The Walt Disney Company (DIS), a massive global conglomerate, wields significant influence with its universally adored resorts, films, streaming platforms, video games, and diverse merchandise. However, dwindling crowd numbers at Disney World hint towards steep entrance fees and growing competition from other establishments, potentially affecting its attendance.
In the second quarter of 2023, total Disney+ subscribers stood at 157.8 million, undergoing a reduction by an additional 4 million. This revelation indicates a continuous quarterly decline, marking back-to-back downtrends after wrapping up 2022 with an unprecedented decline in numbers.
This second consecutive slump was driven by a 4.6 million sequential decline at Disney+ Hotstar, a streaming service variant provided in India and parts of Southeast Asia. Last year, DIS lost streaming rights to Indian Premier League (IPL) cricket matches, which consequently incited a curtailment of the growth target for Disney+ Hotstar in India.
Given this backdrop, let us look at DIS’ key financial metrics trends to understand why it might be wise to avoid the stock.
Analyzing DIS’ Financial Health: Investigating Price/Sales Ratio, Gross Margin, and Current Ratio Trends (2020-2023)"
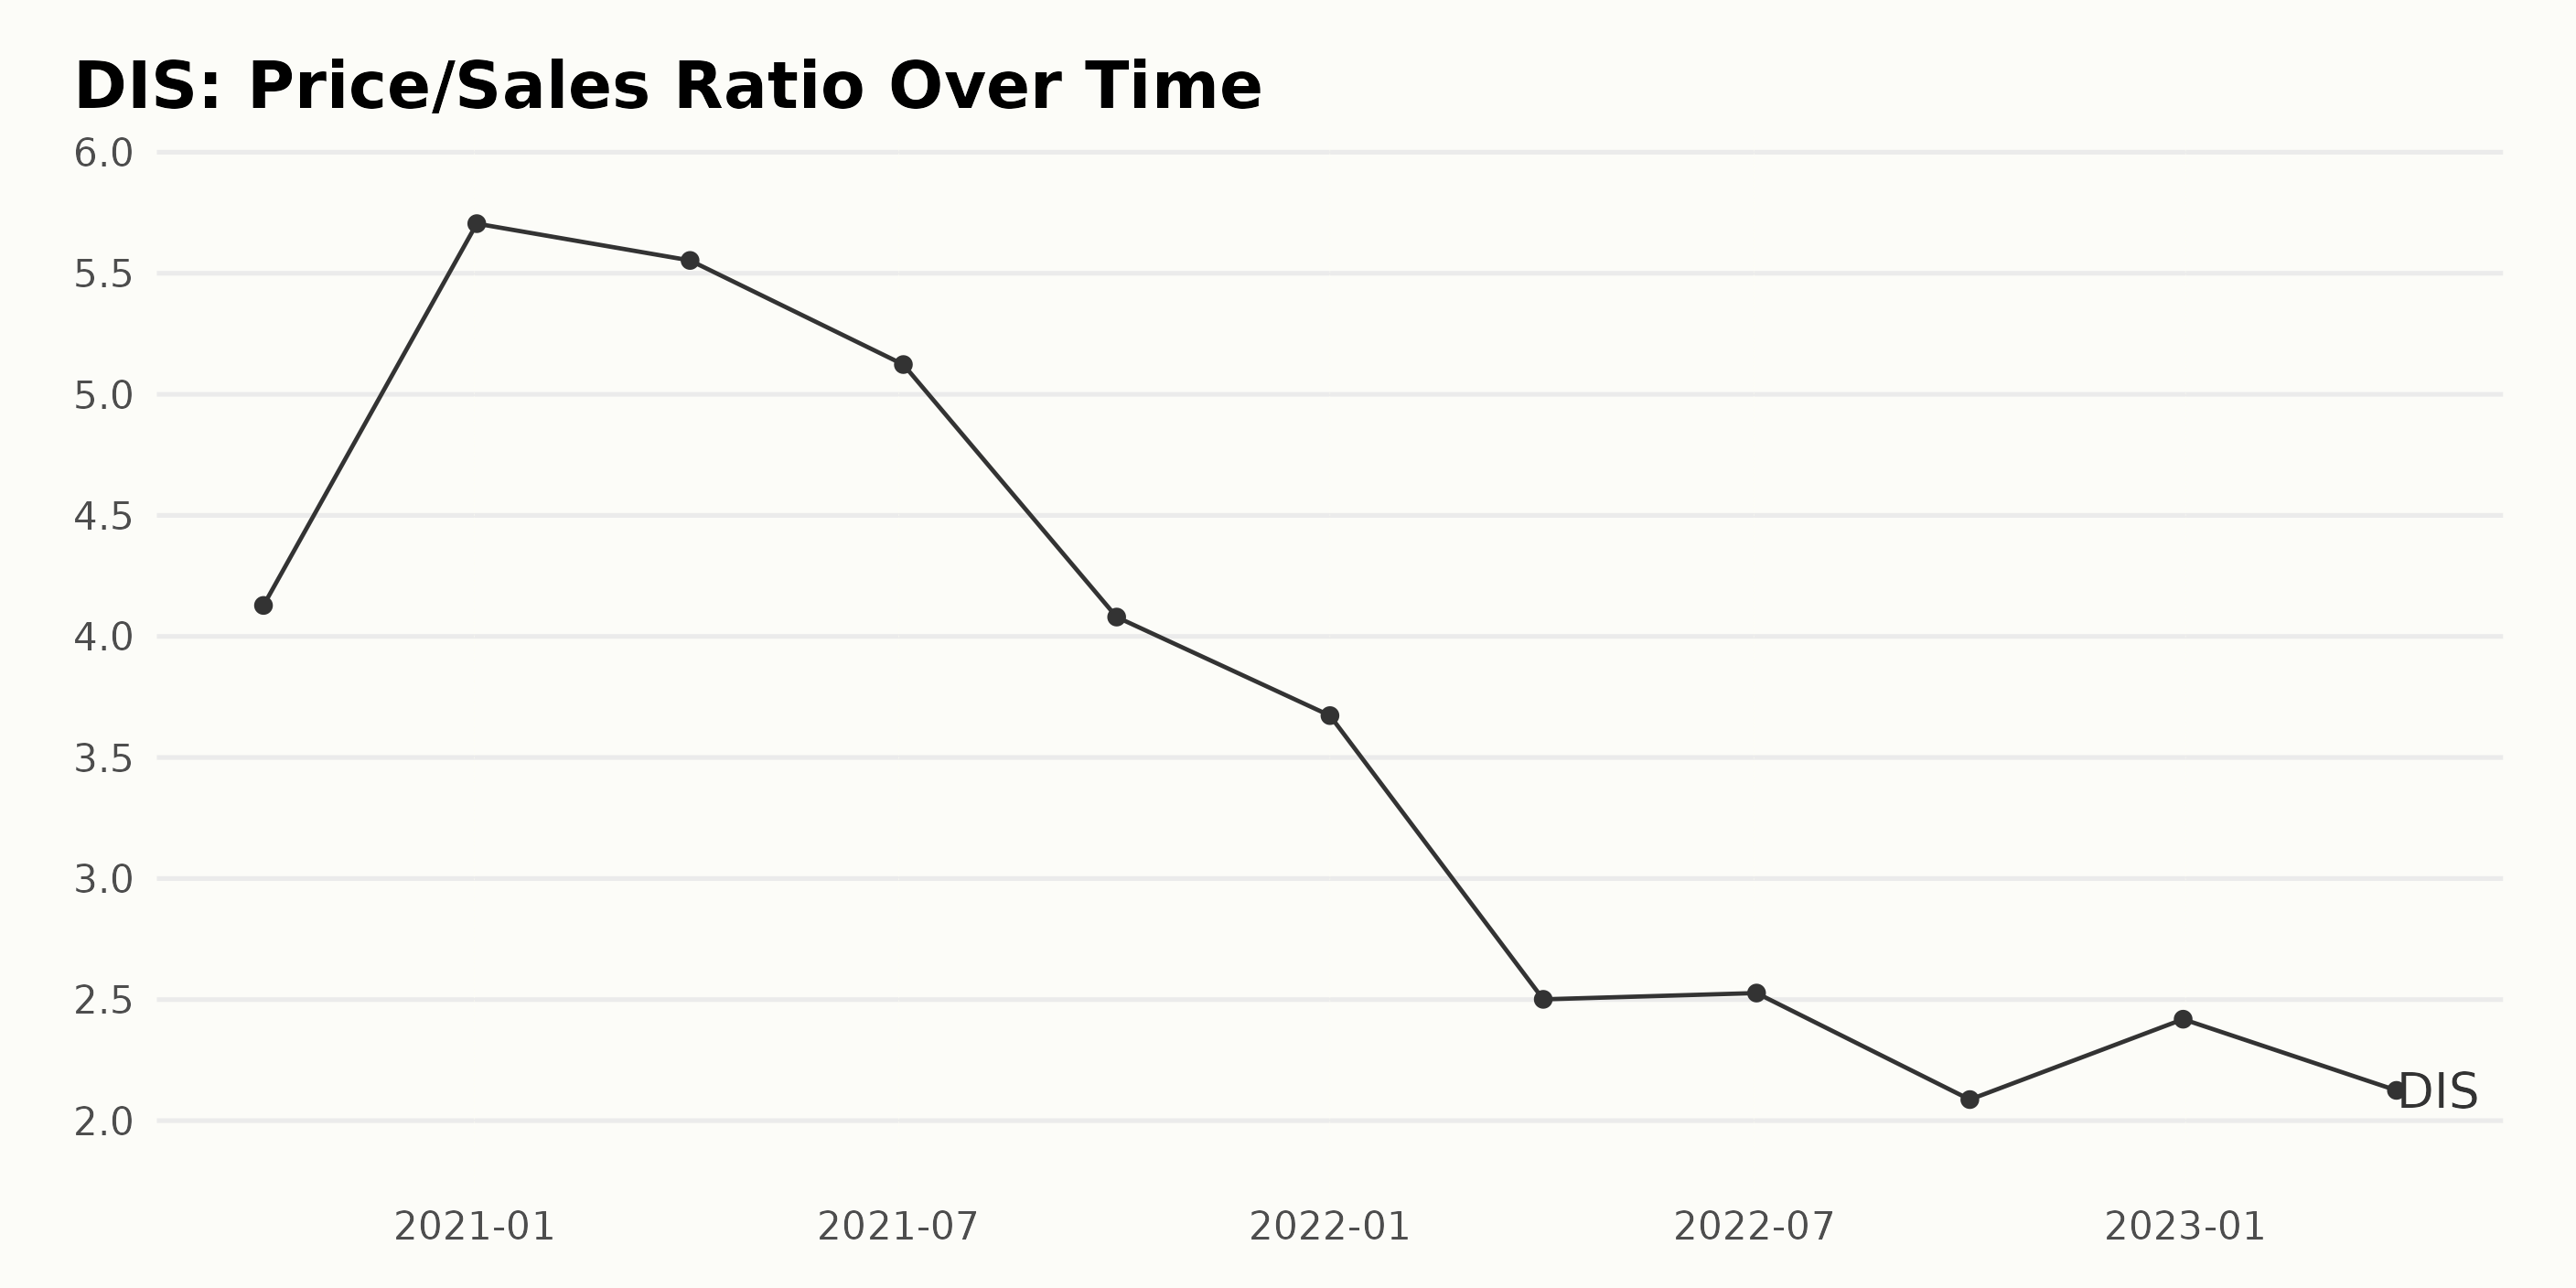
DIS’ Price/Sales (P/S) ratio shows notable fluctuations throughout the reported period, with a general downward trend in recent years. Here is a summarized overview of the trend.
- In October 2020, DIS had a P/S value of 4.13. An increase to 5.71 by January 2021 indicates a significant growth rate.
- A slight decrease occurred in April 2021, with a value of 5.55. July 2021 revealed another drop, moving down to 5.12.
- By October 2021, the ratio further decreased to 4.08 and continued the decline entering 2022 with a P/S of 3.67 in January.
- In April 2022, the P/S significantly declined to 2.50, with a tiny increase in July 2022, bringing it up to 2.53.
- By October 2022, the value again dropped to 2.09, representing a noticeable decline from the start of the period.
- Despite a minor increase at the end of 2022 to 2.42, the ratio decreased again by April 2023 to 2.12.
Despite the fluctuations, the overall trend for DIS' P/S ratio shows a decrease over the reporting period. Notably, the ratio has declined by approximately 48.6% when comparing the first value in October 2020 (4.13) to the most recent value in April 2023 (2.12). Emphasizing more recent data, the significant decrease from 2022 highlights issues DIS may have regarding revenue or perceived value.
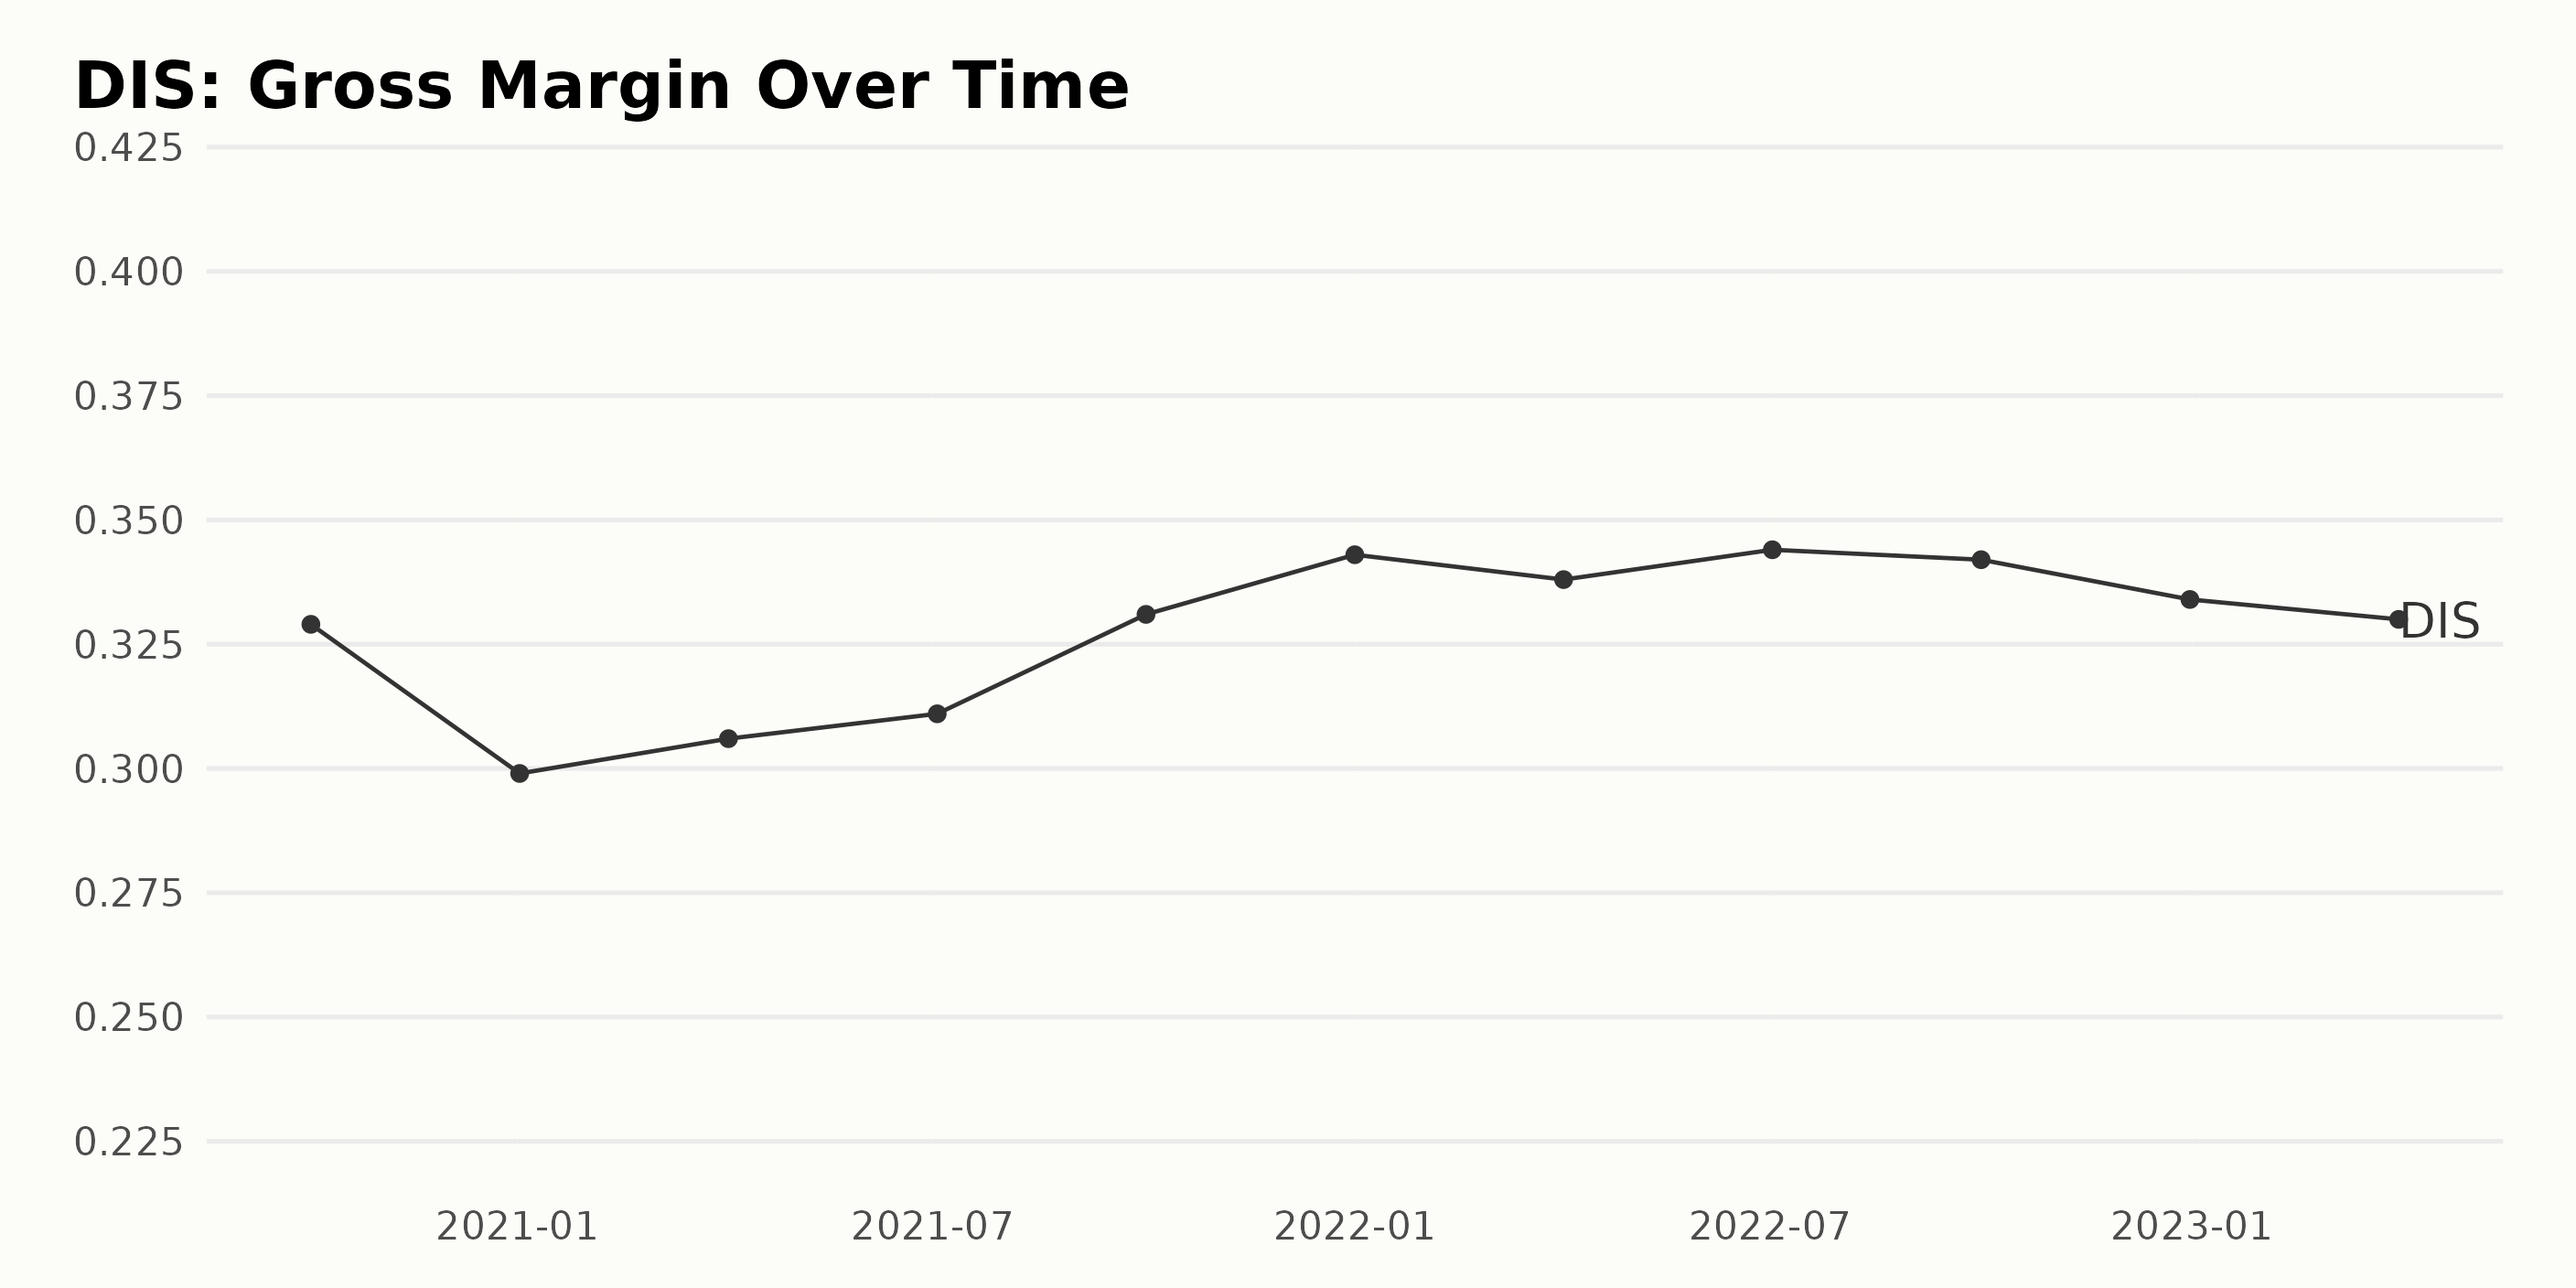
DIS’ gross margin was examined from October 2020 to April 2023. The chronological overview of the reported values, growth trends, and fluctuations are as follows:
- On October 3, 2020, the gross margin was 32.90%.
- By January 2, 2021, there was a decrease to 29.90%.
- An increasing trend was observed, with the gross margin increasing to 30.60% as of April 3, 2021.
- A similar increment was noted by July 3, 2021, when it was 31.10%.
- It rose further to 33.10% as of October 2, 2021.
- A notable growth was seen at the beginning of 2022, with the gross margin reaching 34.30% on January 1.
- However, by April 2, 2022, this dipped slightly to 33.80%.
- A slight increase in gross margin to 34.40% on July 2, 2022, was observed.
- The trend reversed and declined to 34.20% on October 1, 2022.
- On December 31, 2022, it declined to 33.40%.
- As of April 1, 2023, it decreased to 33%.
Within the given timeframe, DIS’ gross margin has shown a fluctuating trend, marked by occasional increases and decreases. Despite these fluctuations, in terms of overall growth rate, the gross margin has only increased by 1% from the first value in October 2020 to the last value in April 2023.
The highest recorded value during this period was 34.40% in July 2022, while the lowest was 29.90% in January 2021. While all past years have shown fluctuations, a closer look at the most recent timings reveals a downward trend.
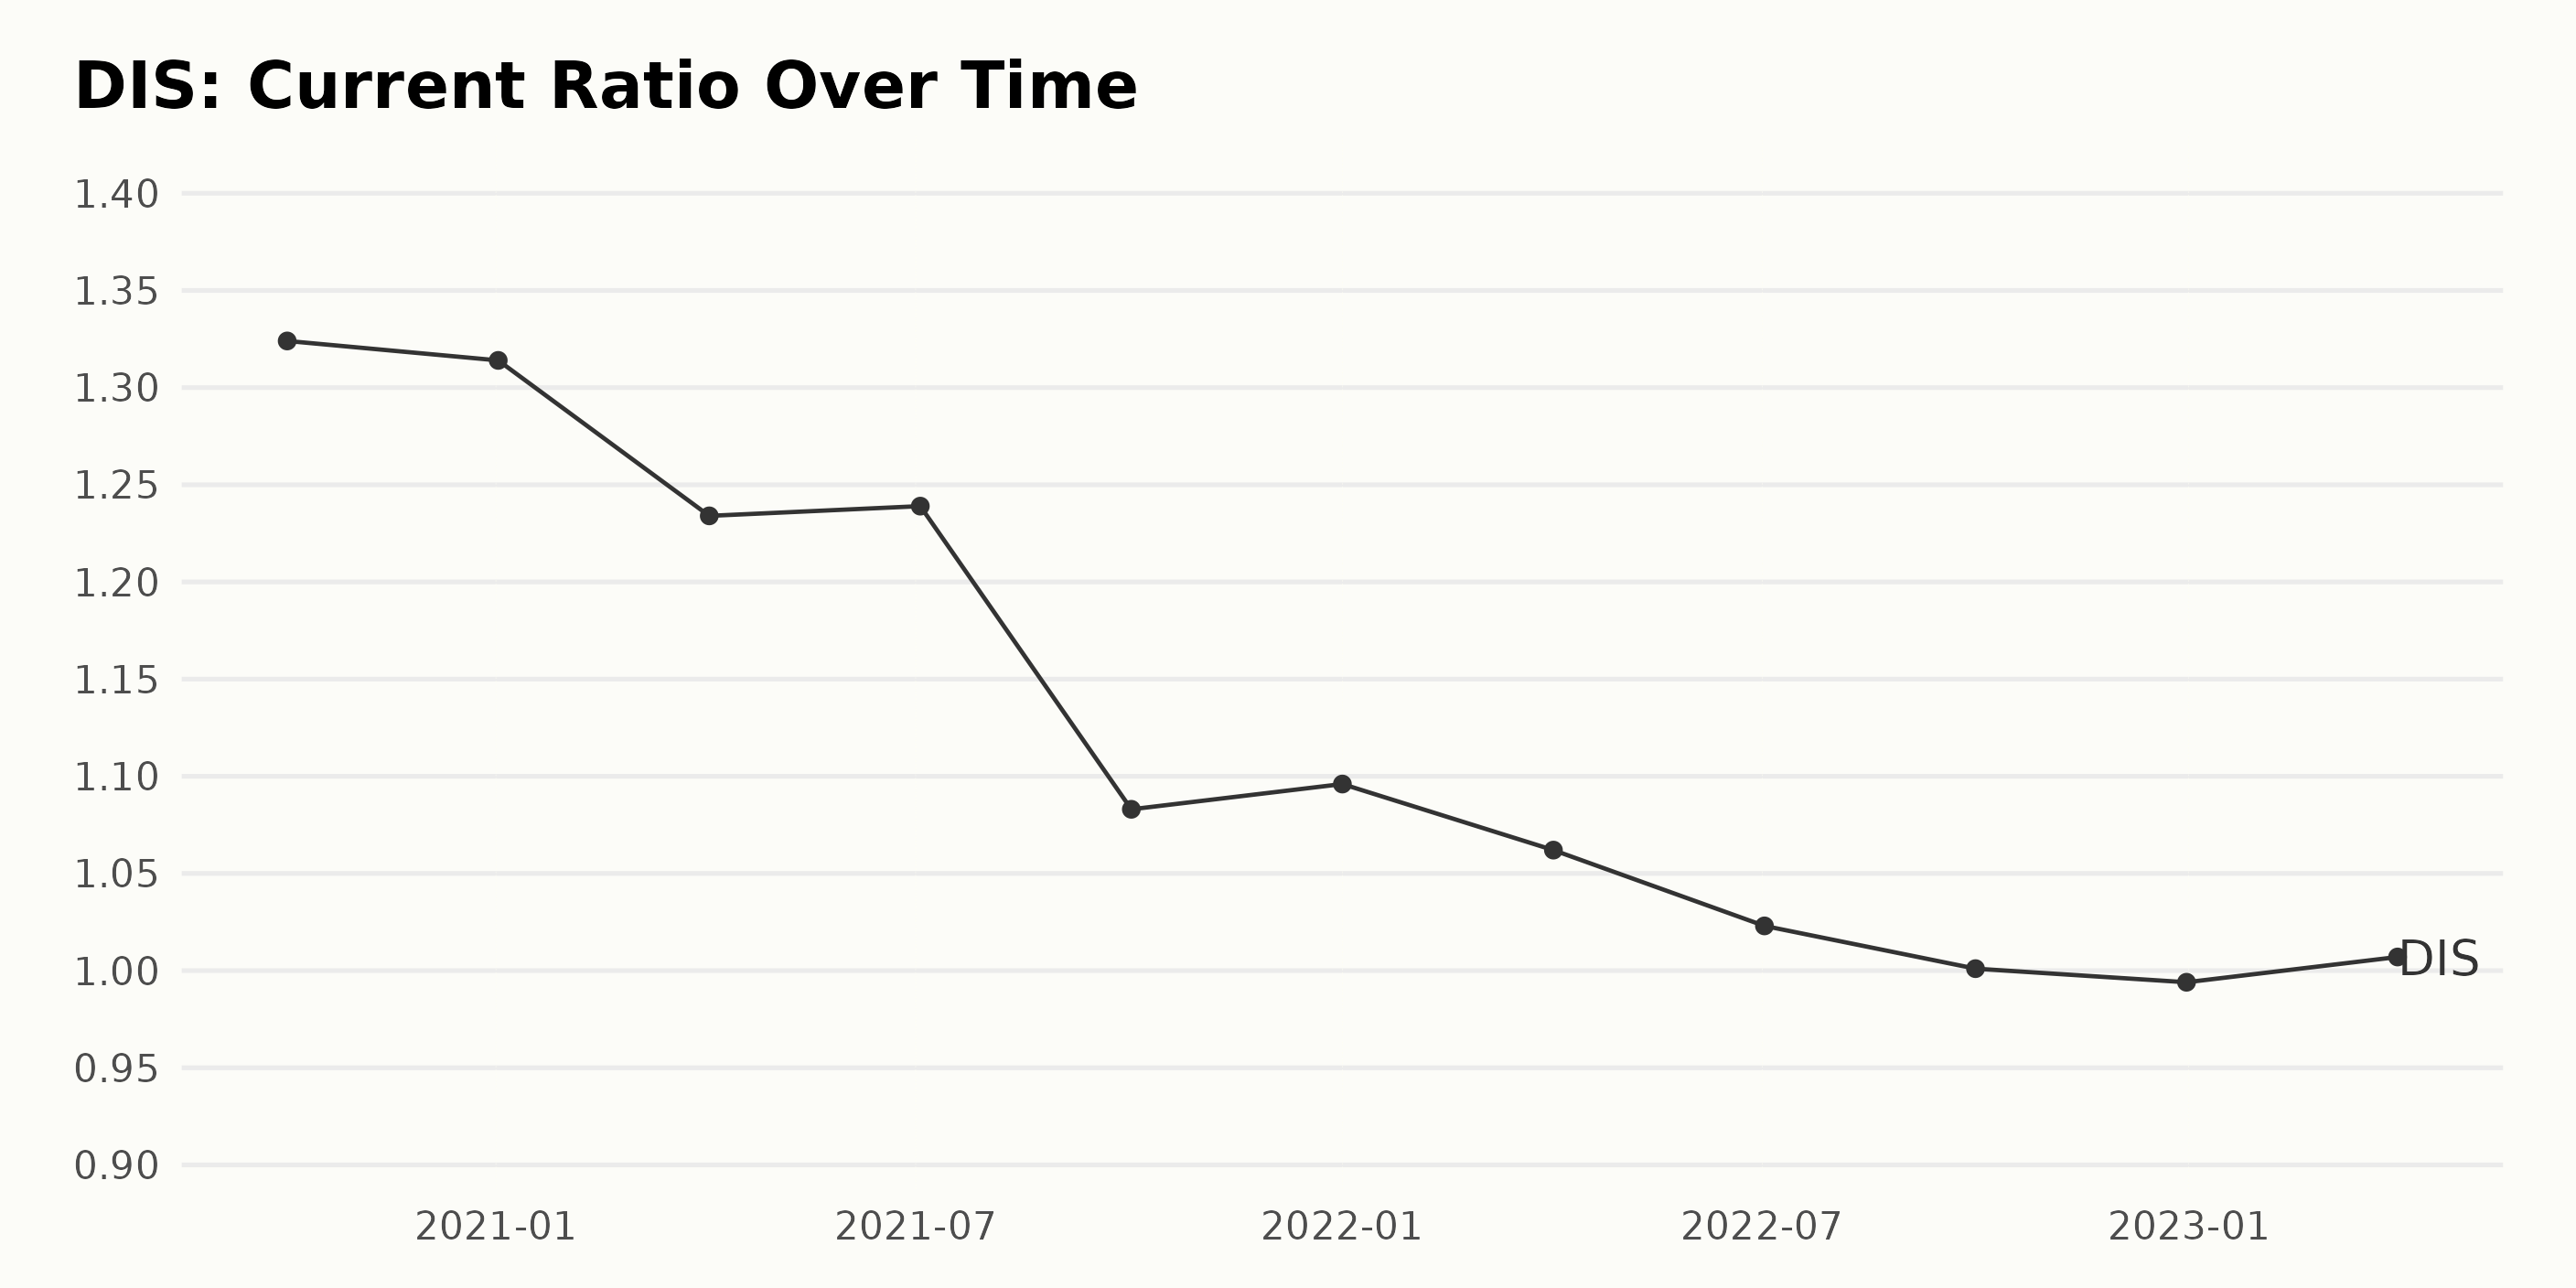
DIS’ current ratio has shown an overall decreasing trend from October 2020 to April 2023. Here are more specific observations:
- Starting at 1.32 in October 2020, the current ratio slightly decreased to 1.31 in January 2021.
- A steeper decline of 1.23 by April 2021 was followed by a marginal increase to 1.24 in July 2021.
- By October 2021, there was another notable drop making it 1.08. The ratio maintained a steady decline to 1.06 in April 2022 and 1.02 in July 2022.
- In October 2022, the ratio almost hit 1.00 and dipped slightly to 0.994 at the end of December 2022.
- Despite the continued downward trend, there was an increase to 1.007 in April 2023, indicating a minor upswing.
The growth rate during this period, calculated from the first value to the last, shows an approximately negative 24% change. This value indicates a reduction in the current ratio from October 2020 to April 2023. Greater emphasis on the current data suggests that despite showing signs of recovery in April 2023, DIS' current ratio remains lower than in October 2020.
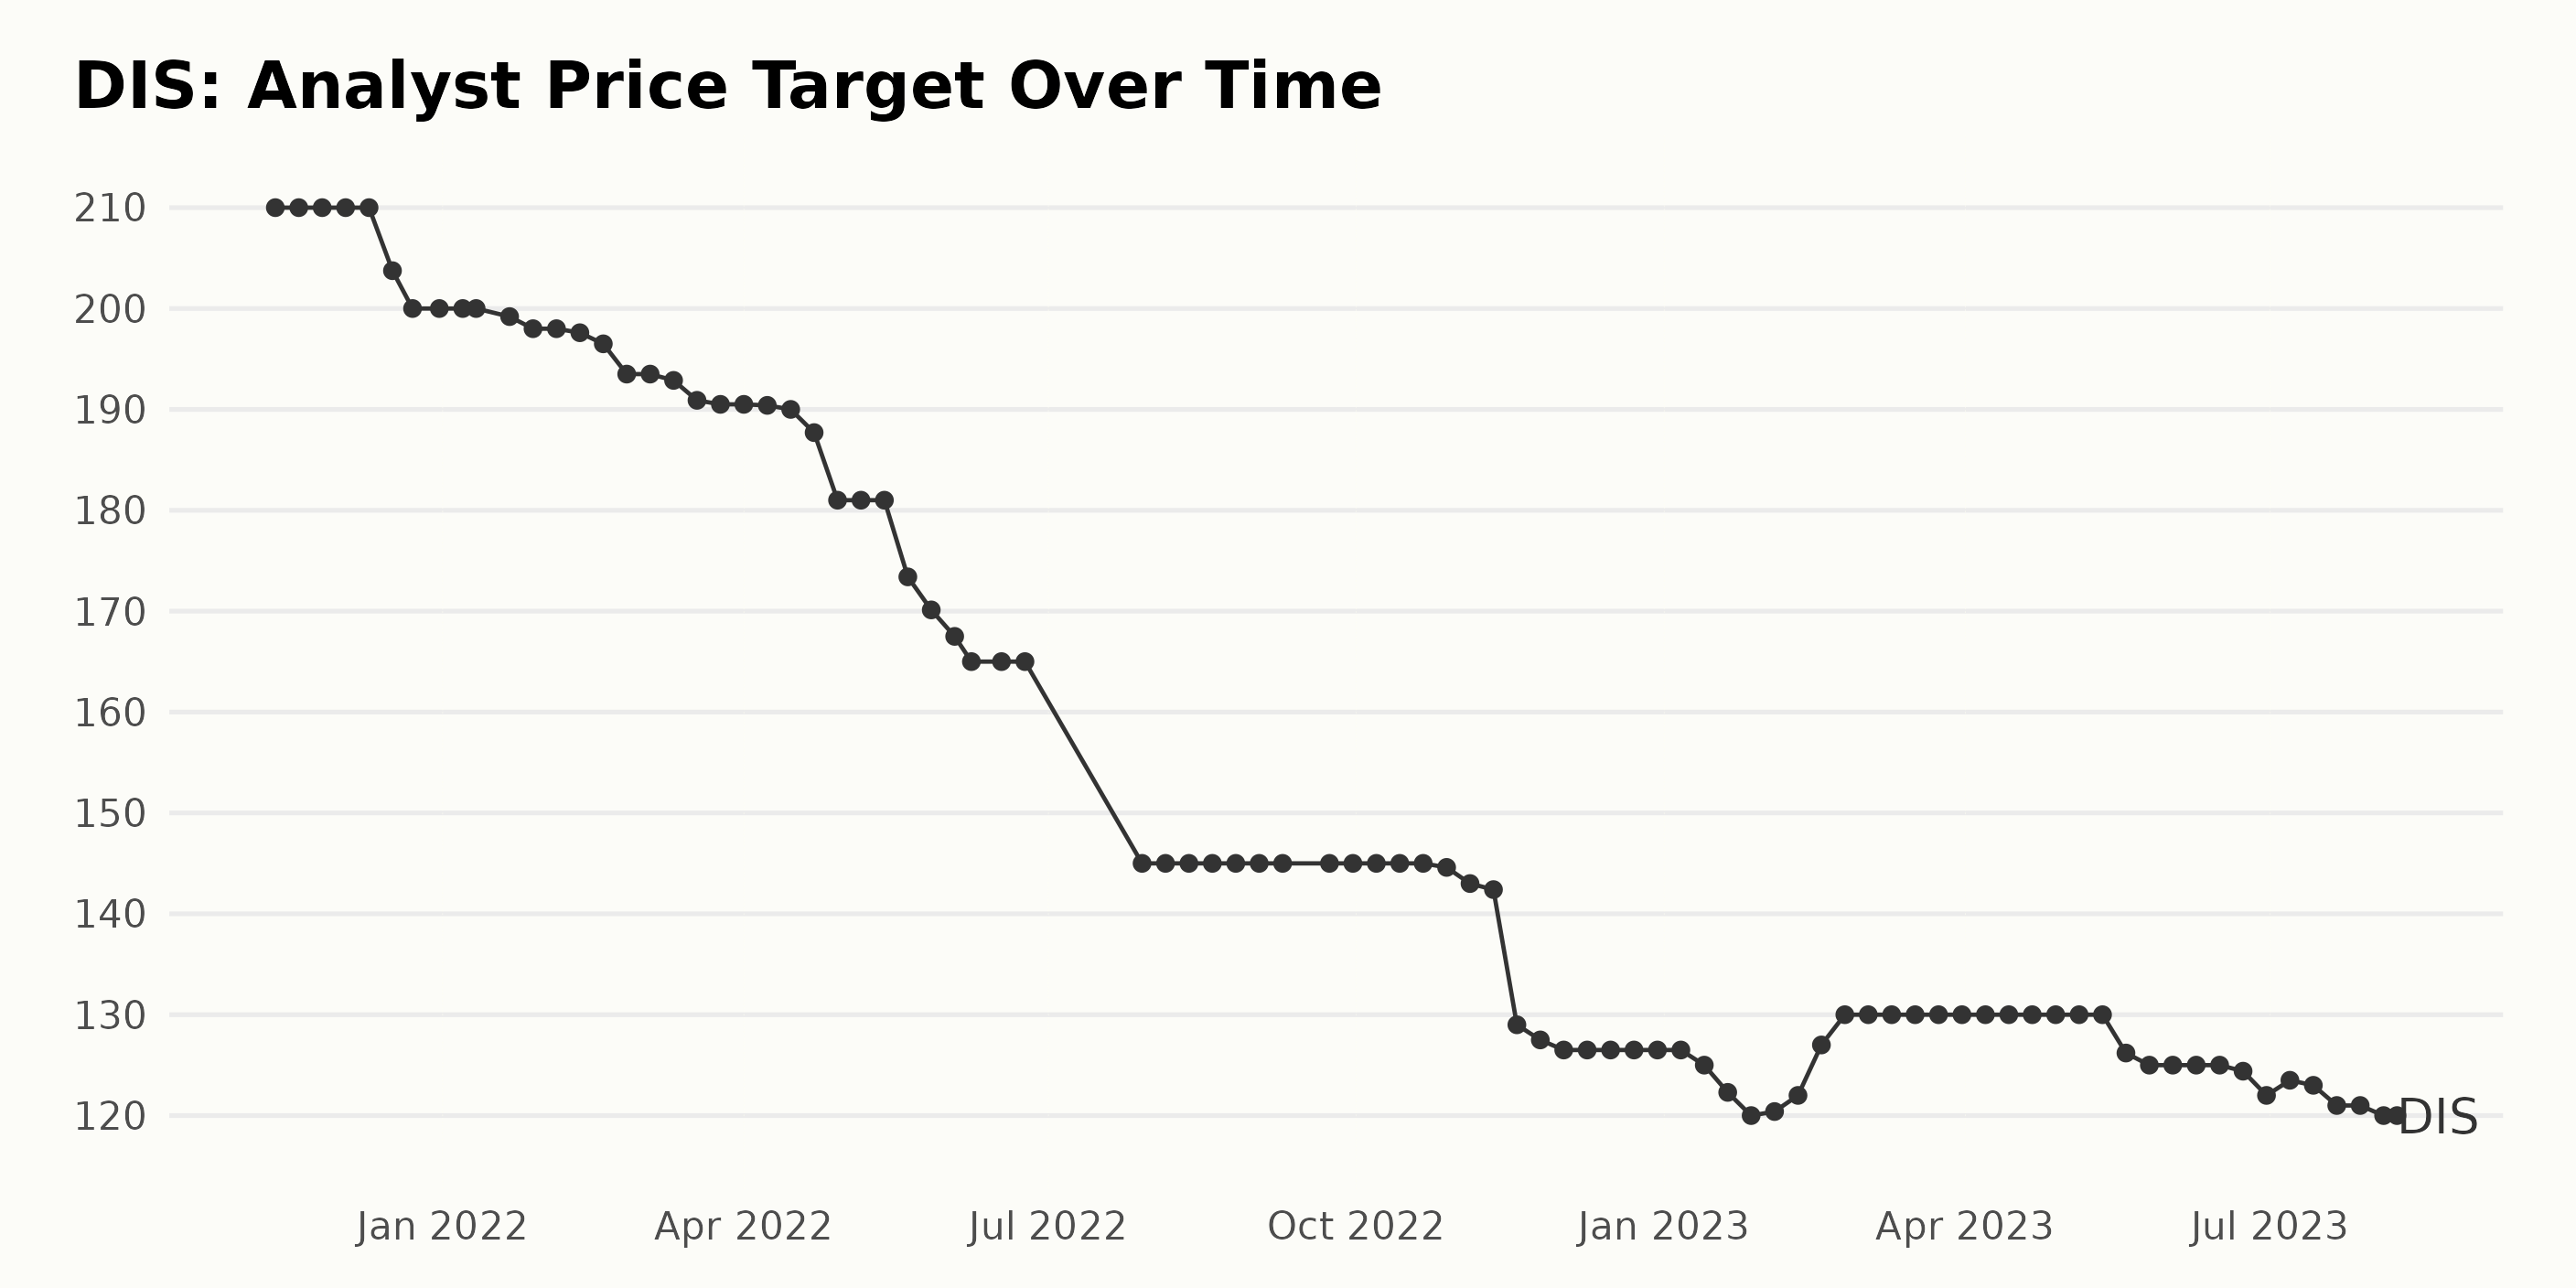
The data series depicts the fluctuation in DIS’ analyst price target from November 12, 2021, to August 8, 2023.
- In November 2021, the value was $210. Stability in this figure was noticed until early December 2021.
- From mid-December 2021 onwards, a consistent decline is observed, leading to a significant drop to $145 by July 2022, which represents a decrease of about 31%.
- This downward trend continued till November 2022, when the analyst price target decreased further to $126.5.
- The following months have seen fluctuations, including a small hike and subsequent decreases towards the end of the data series.
- The price target began to wane again around May 2023, finally resting at $120 as of the last recorded data on August 8, 2023
Overall, it is evident that DIS’ analyst price target has shown a trend of gradual decline. Between the first instance on November 12, 2021, and the final data point on August 8, 2023, there has been a descent of about 42% in the reported values.
This widely varies from initial expectations and indicates changes in market sentiment towards the company. Emphasis has been given to recent trends observed in the last few months, indicative of a move toward stability compared to the sharper declines seen in 2022.
DIS’ Share Price Plunge: A Detailed Look into February-August 2023 Decline
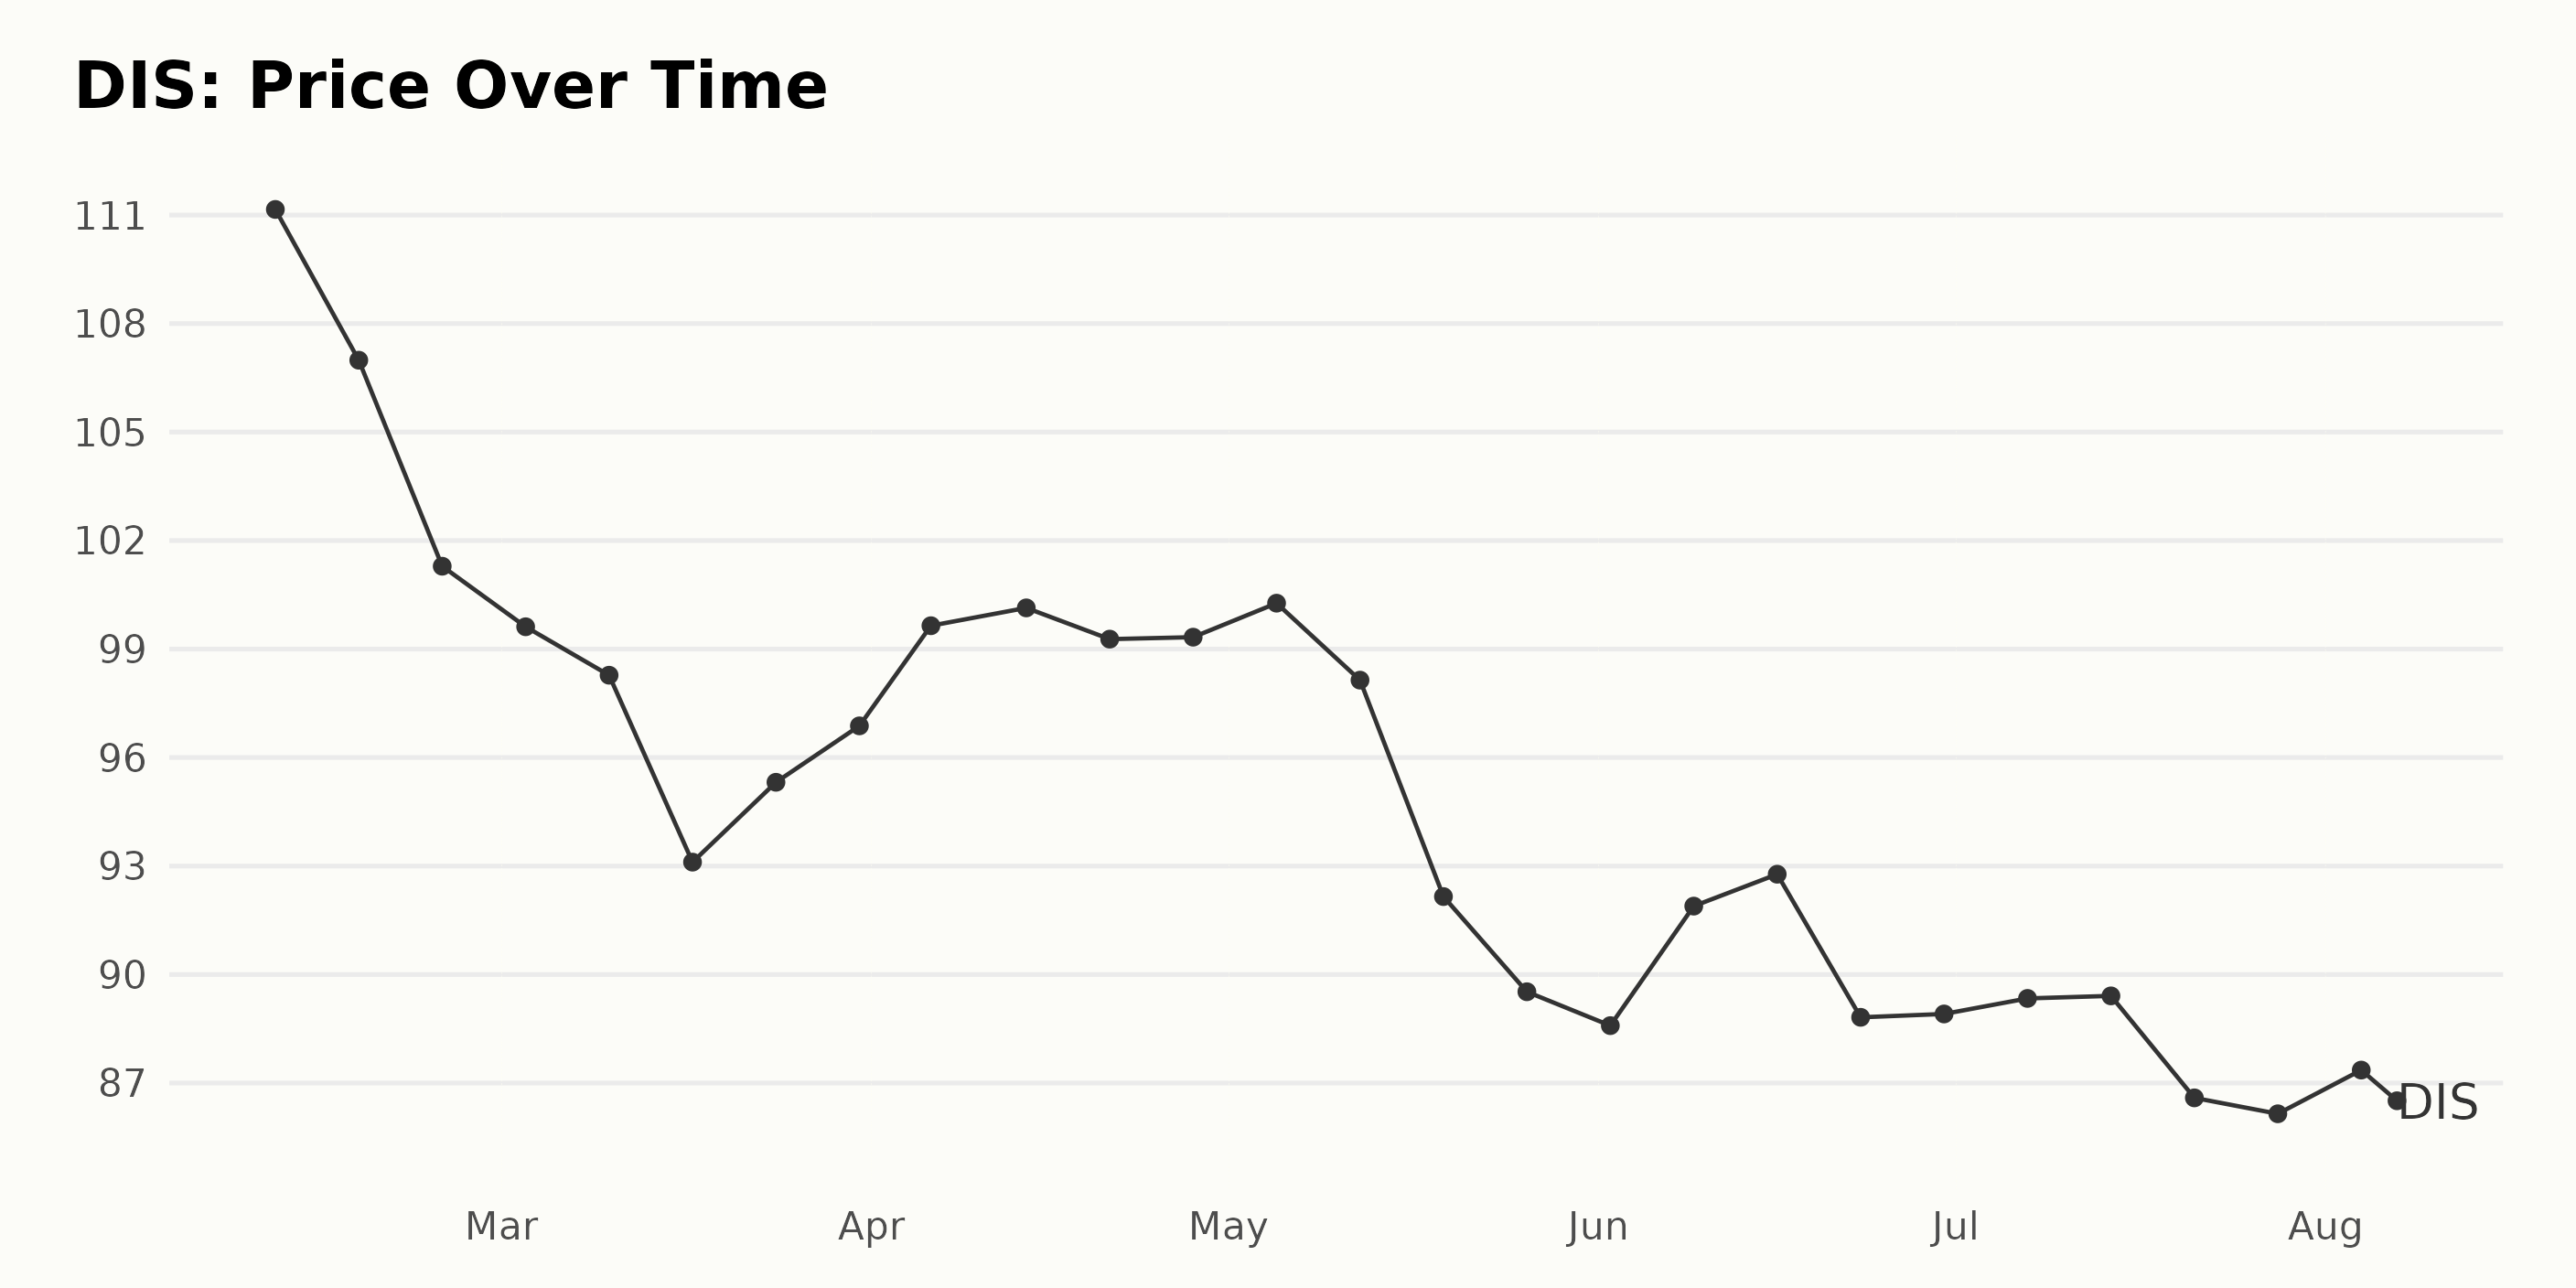
Based on the given data, DIS has shown a declining trend in its share price from February 2023 to August 2023.
- On February 10, 2023, DIS' share price was at its highest for the period at $111.16.
- There was a notable decrease in the share price over the next two weeks, with values of $106.99 and $101.29 on February 17 and February 24, respectively.
- The decline continued into March 2023, reaching a low of $93.11 by March 17 but rebounded slightly to $96.88 by the end of the month.
- In April 2023, DIS' share price increased again, peaking at $100.14 before decreasing slightly to $99.33 at the end of the month.
- There was another drop in May 2023, with the share price falling from a high of $100.27 to a low of $89.52 by May 26.
- The downward trend persisted into June but reversed near the middle of the month. After reaching a low of $88.59, the share price went back to $92.77 by June 16. However, the price went down again to $88.91 at the end of the month.
- In July 2023, DIS' share price remained relatively steady, fluctuating between $89.41 and $86.15.
- By early August, the share price was slightly up at $87.36 but decreased to $86.51 by August 7, 2023.
In conclusion, the overall growth rate was negative from February 2023 to August 2023. An ongoing declining trend could be noticed with occasional minor recoveries. The downward trend seems to be decelerating, with several instances of brief growth along the way. Here is a chart of DIS' price over the past 180 days.
Tracking DIS’ 2023 Performance: A Study of Growth, Sentiment, and Stability
The overall POWR Ratings of DIS in the F-rated Entertainment - Media Producers category fluctuated between D (Sell) and C (Neutral) ratings over the period presented. As of the latest available data on August 7, 2023, DIS’ overall POWR Ratings grade is a D, equating to Sell, with its rank in the category being #10 out of 13 stocks. As per the data available below, here are a few notable points:
- On February 11, 2023, the POWR Grade for DIS was consistently D (Sell) until late March.
- It showed a slight improvement as of the week of March 25, 2023, when it moved up to grade C (Neutral). This heightened rating remained constant for the weeks of April 1, 2023, and April 8, 2023.
- It fell back to grade D (Sell) from the week of April 15, 2023.
- The grade once again improved to grade C (Neutral) for the week of April 22, 2023, but fell back to D (Sell) by April 29, 2023, and has remained consistent at this lower rating up until the latest data point provided, which is the week of August 5, 2023.
- In terms of its rank within the category, DIS improved marginally towards the end of February and throughout March 2023 to reach a ranking of 8 by the start of April 2023.
- Throughout April 2023, despite experiencing a fluctuation in its POWR grade from C (Neutral) to D (Sell), DIS held its improved ranking at #8. From mid-May 2023 onwards, the POWR grade consistently remained D (Sell), even while its category rank slipped slightly from #8 to #10.
Being ranked #10 out of 13 means DIS is performing better than some other stocks in the category but is not among the top performers.
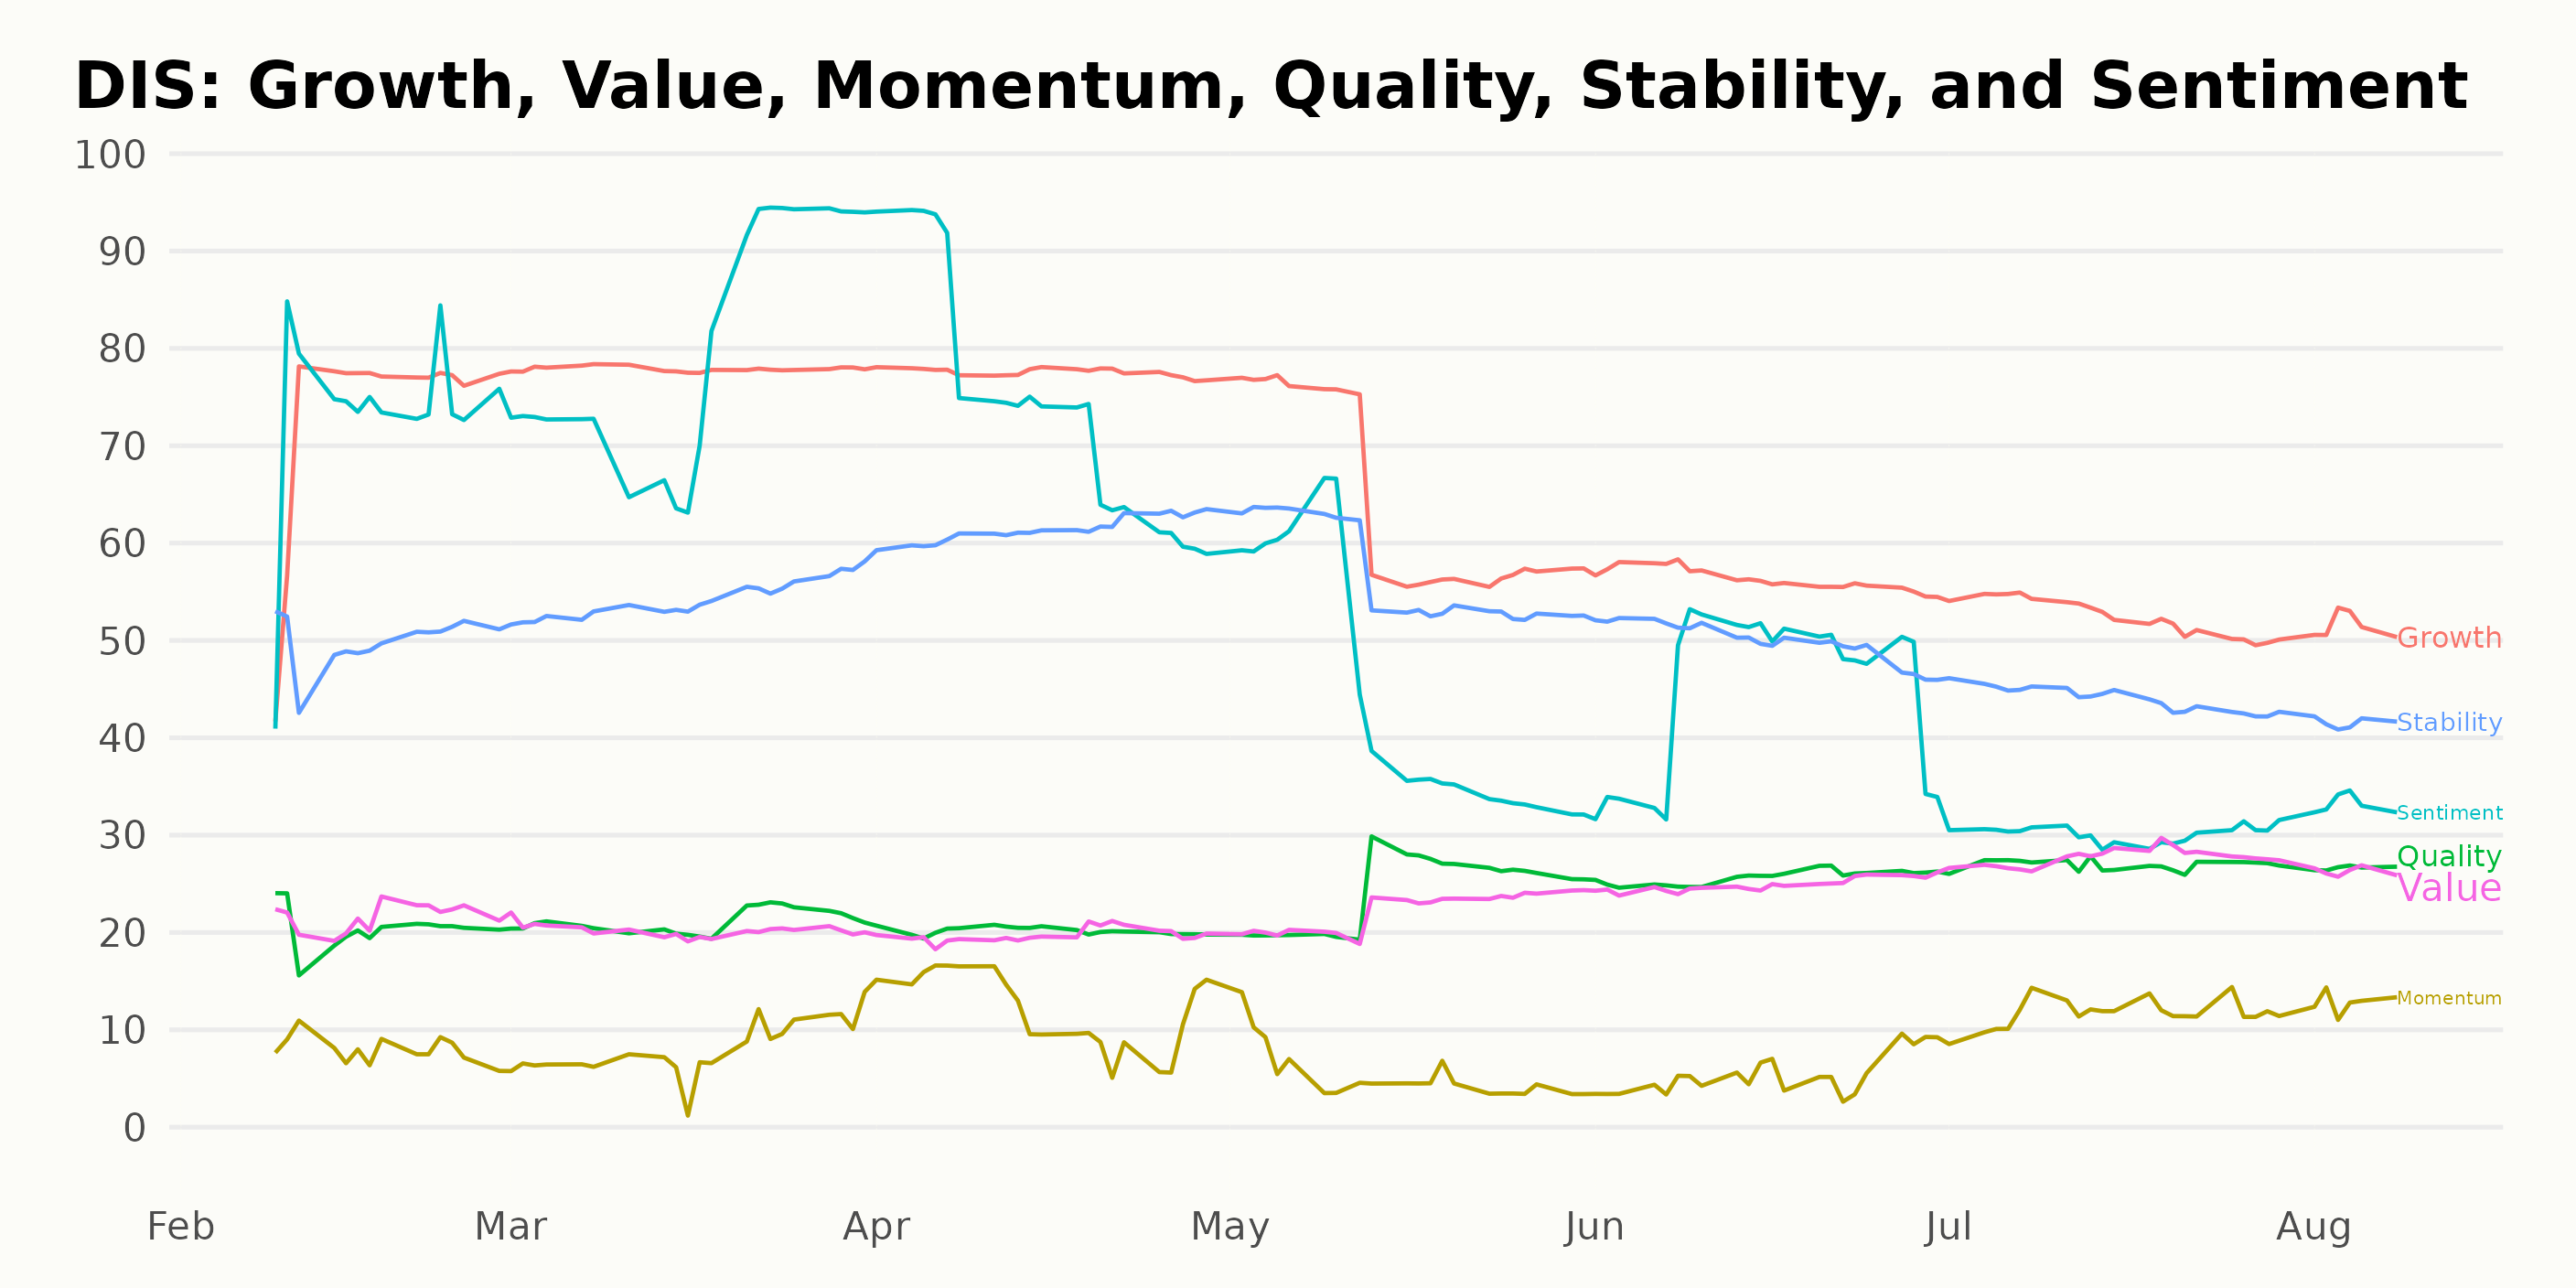
Based on POWR Ratings, three key dimensions for DIS are noteworthy: Growth, Sentiment, and Stability dimensions.
Growth: The Growth dimension measures the company's growth prospects. For DIS, the Growth rating substantially decreased from February to August 2023.
- In February 2023, the Growth rating was relatively high at 73.
- Despite a brief increase to 78 in March and April 2023, there was a noticeable downtrend, with the rating dropping to 52 by July and August 2023.
Sentiment: The Sentiment dimension indicates the market sentiment towards DIS. This dimension also demonstrated a significant decline over time.
- Starting relatively high at 73 in February 2023, it rose to its peak at 81 in March 2023.
- However, the following months saw a substantive drop, with the sentiment rating reaching just 30 in July 2023 before slightly recovering to 33 in August 2023.
Stability: The Stability dimension, which indicates the consistency and reliability of DIS's financial performance, showed mild fluctuations over the monitored months.
- The rating started at 50 in February 2023 and peaked at 61 in April 2023.
- Following this peak, there was a general downward trend, with the stability rating lowering to 42 by August 2023.
These trends may be important factors for considering DIS’ performance and prospects.
How Does The Walt Disney Company (DIS) Stack Up Against Its Peers?
While DIS has an overall grade of D, equating to a Sell rating, check out these other stocks within the Entertainment - Media Producers industry with better ratings: News Corporation (NWSA), Vivendi SE (VIVHY), and Sony Group (SONY).
What To Do Next?
Discover 10 widely held stocks that our proprietary model shows have tremendous downside potential. Please make sure none of these “death trap” stocks are lurking in your portfolio:
DIS shares were trading at $86.76 per share on Tuesday afternoon, down $0.07 (-0.08%). Year-to-date, DIS has declined -0.14%, versus a 17.72% rise in the benchmark S&P 500 index during the same period.
About the Author: Sristi Suman Jayaswal

The stock market dynamics sparked Sristi's interest during her school days, which led her to become a financial journalist. Investing in undervalued stocks with solid long-term growth prospects is her preferred strategy. Having earned a master's degree in Accounting and Finance, Sristi hopes to deepen her investment research experience and better guide investors.
The post Is August the Time to Buy or Sell Walt Disney (DIS)? appeared first on StockNews.com