The monthly dividend company Realty Income Corporation (O) is structured as a Real Estate Investment Trust (REIT), with its monthly dividends supported by cash flow from several real estate properties.
In February, it was reported that the company would partner with Softbank-backed vertical farming startup Plenty Unlimited Inc. to invest up to $1 billion to build a farming space leased for the startup company. Providing a capital source for Plenty's strawberry farm could benefit Realty Income.
However, O’s trailing-12-month asset turnover ratio of 0.07x is 43% lower than the industry average of 0.13x. Moreover, its trailing-12-month ROTA, ROTC, and ROCE of 1.75%, 1.89%, and 3.27% are 10.4%, 8.5%, and 25% lower than the 1.96%, 2.06%, and 4.36% industry averages.
Moreover, the stock closed its last trading session at $59.95, lower than its 50-day moving average of $60.89 and 200-day moving average of $62.72, indicating a downtrend.
Hence, let’s look at O’s key financial metrics trends to understand why it could be wise to avoid the stock now.
Analyzing Realty Income Corporation's Financial Performance: Key Metrics and Trends (June 2020-March 2023)
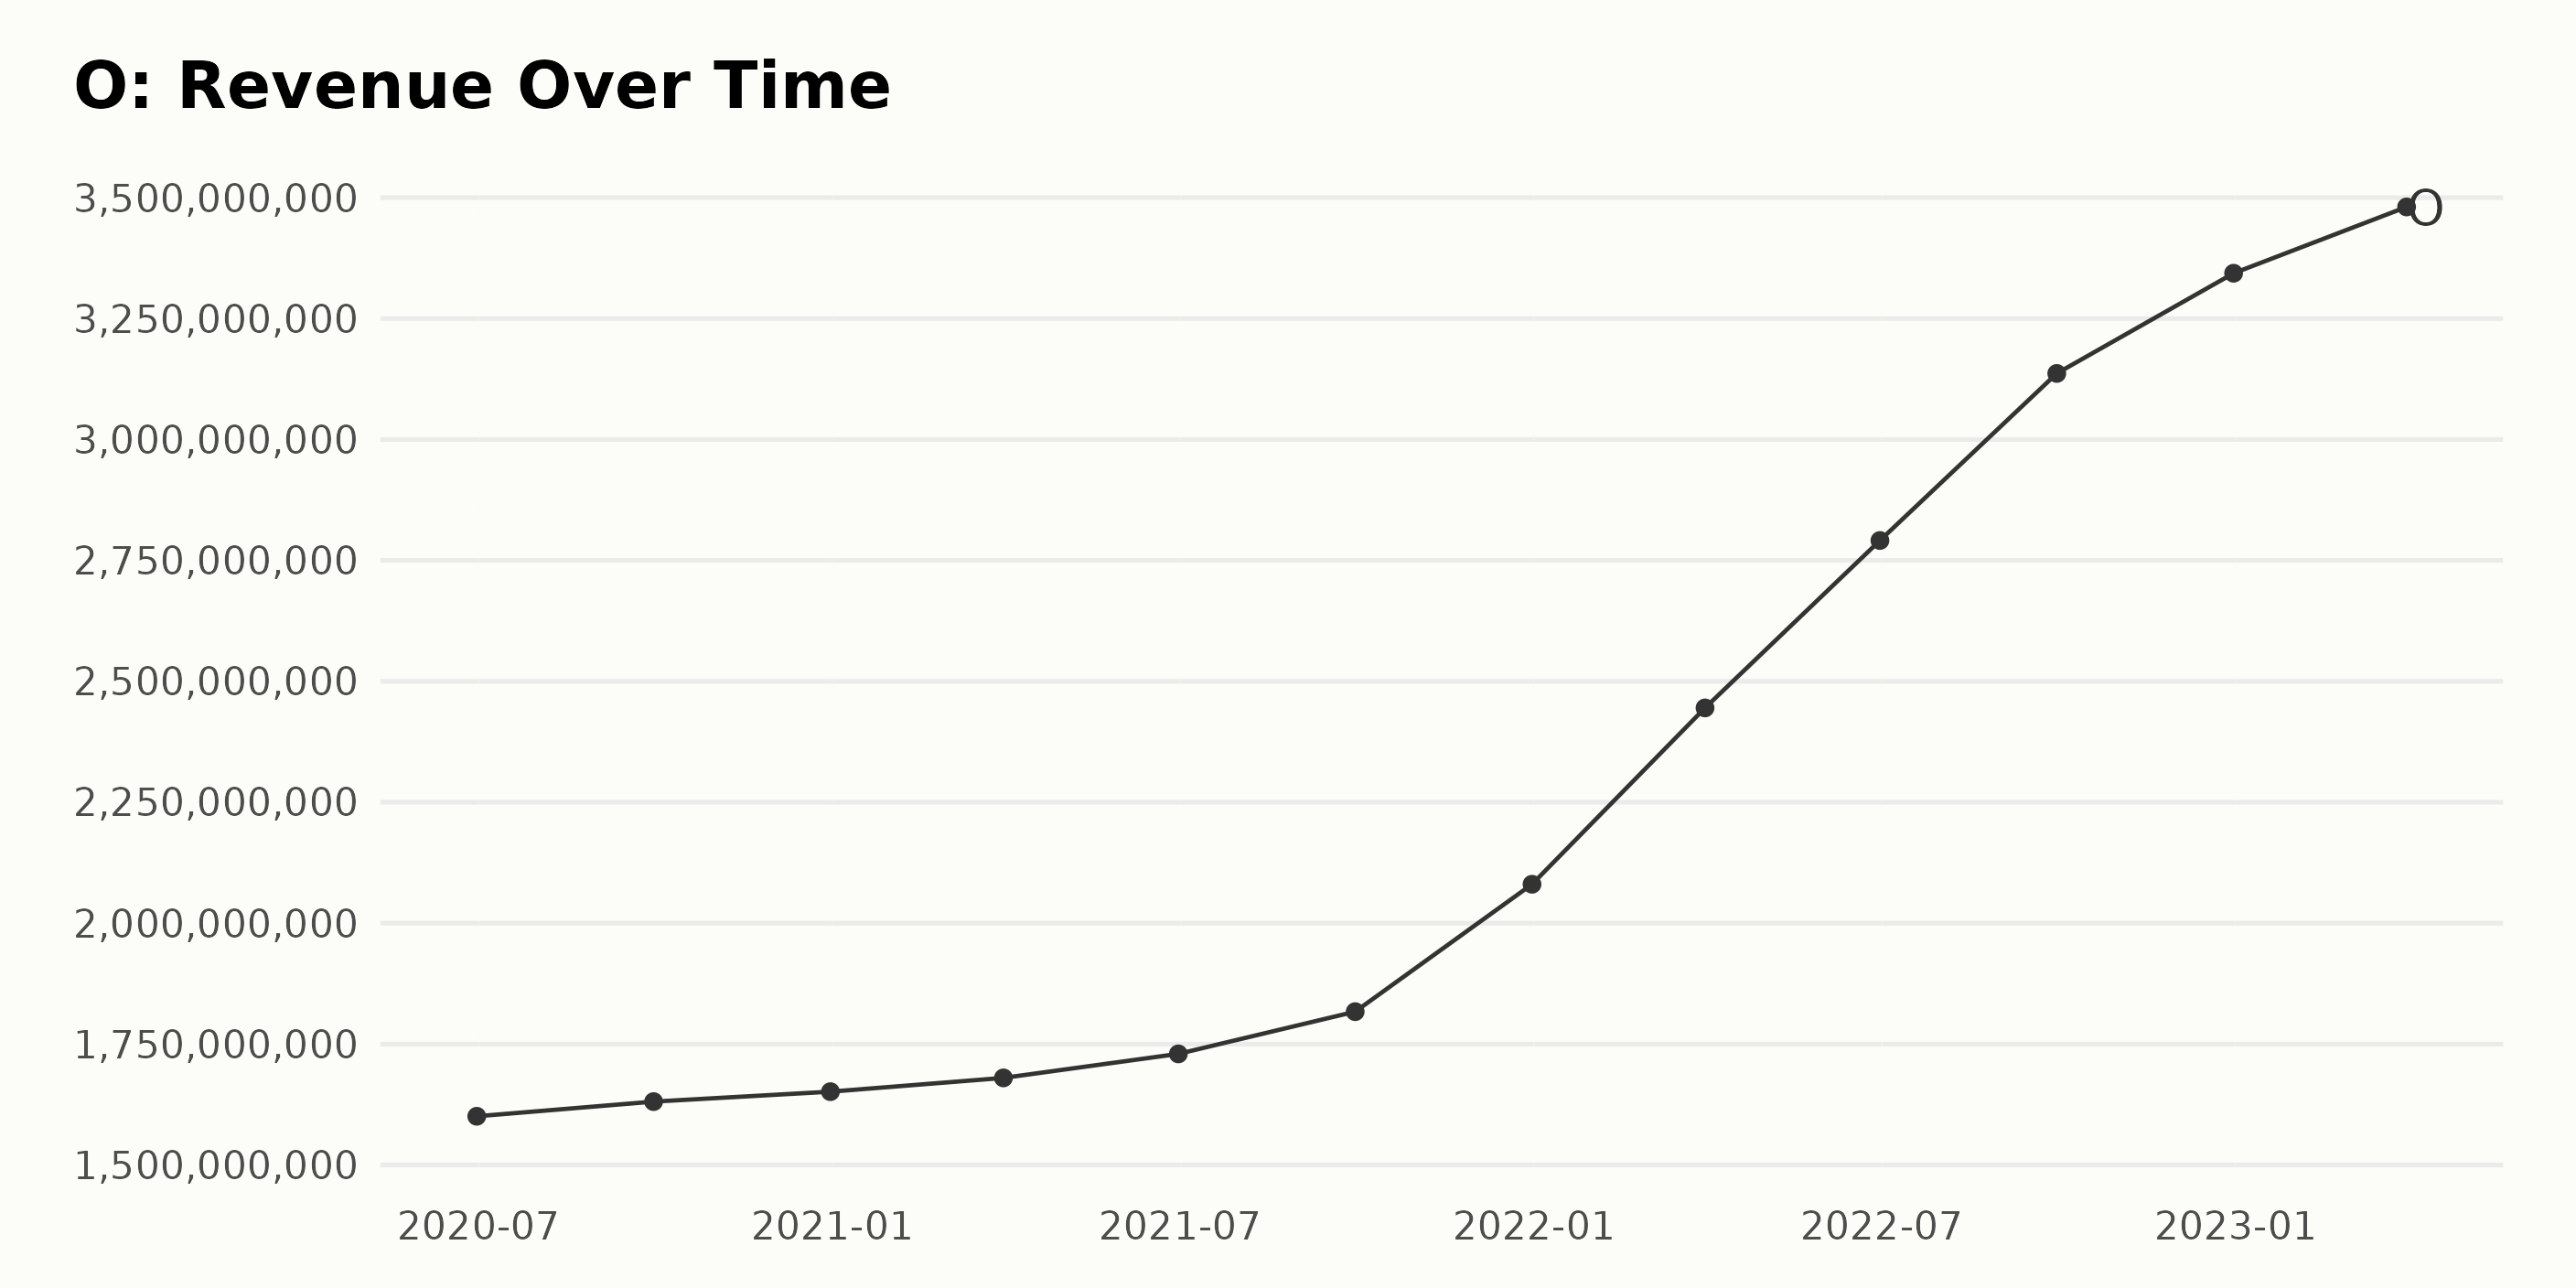
O’s trailing-12-month revenue has followed an upward trend year over year, with increasing fluctuations since 2020. An overview of the revenue fluctuations is as follows:
- June 2020: $1.60 billion
- September 2020: $1.63 billion
- December 2020: $1.65 billion
- March 2021: $1.68 billion
- June 2021: $1.73 billion
- September 2021: $1.82 billion
- December 2021: $2.08 billion
- March 2022: $2.44 billion
- June 2022: $2.79 billion
- September 2022: $3.14 billion
- December 2022: $3.34 billion
- March 2023: $3.48 billion
Notably, in recent periods, the revenue growth rate has been more substantial. A significant increase can be observed between September 2022 ($3.14 billion) and March 2023 ($3.48 billion).
Comparing the revenue from June 2020 ($1.60 billion) to the last value in the series in March 2023 ($3.48 billion), the growth rate is approximately 117.54%. Emphasizing the more recent data, though consistent fluctuations were observed, the overall trend for O’s revenue is growing.
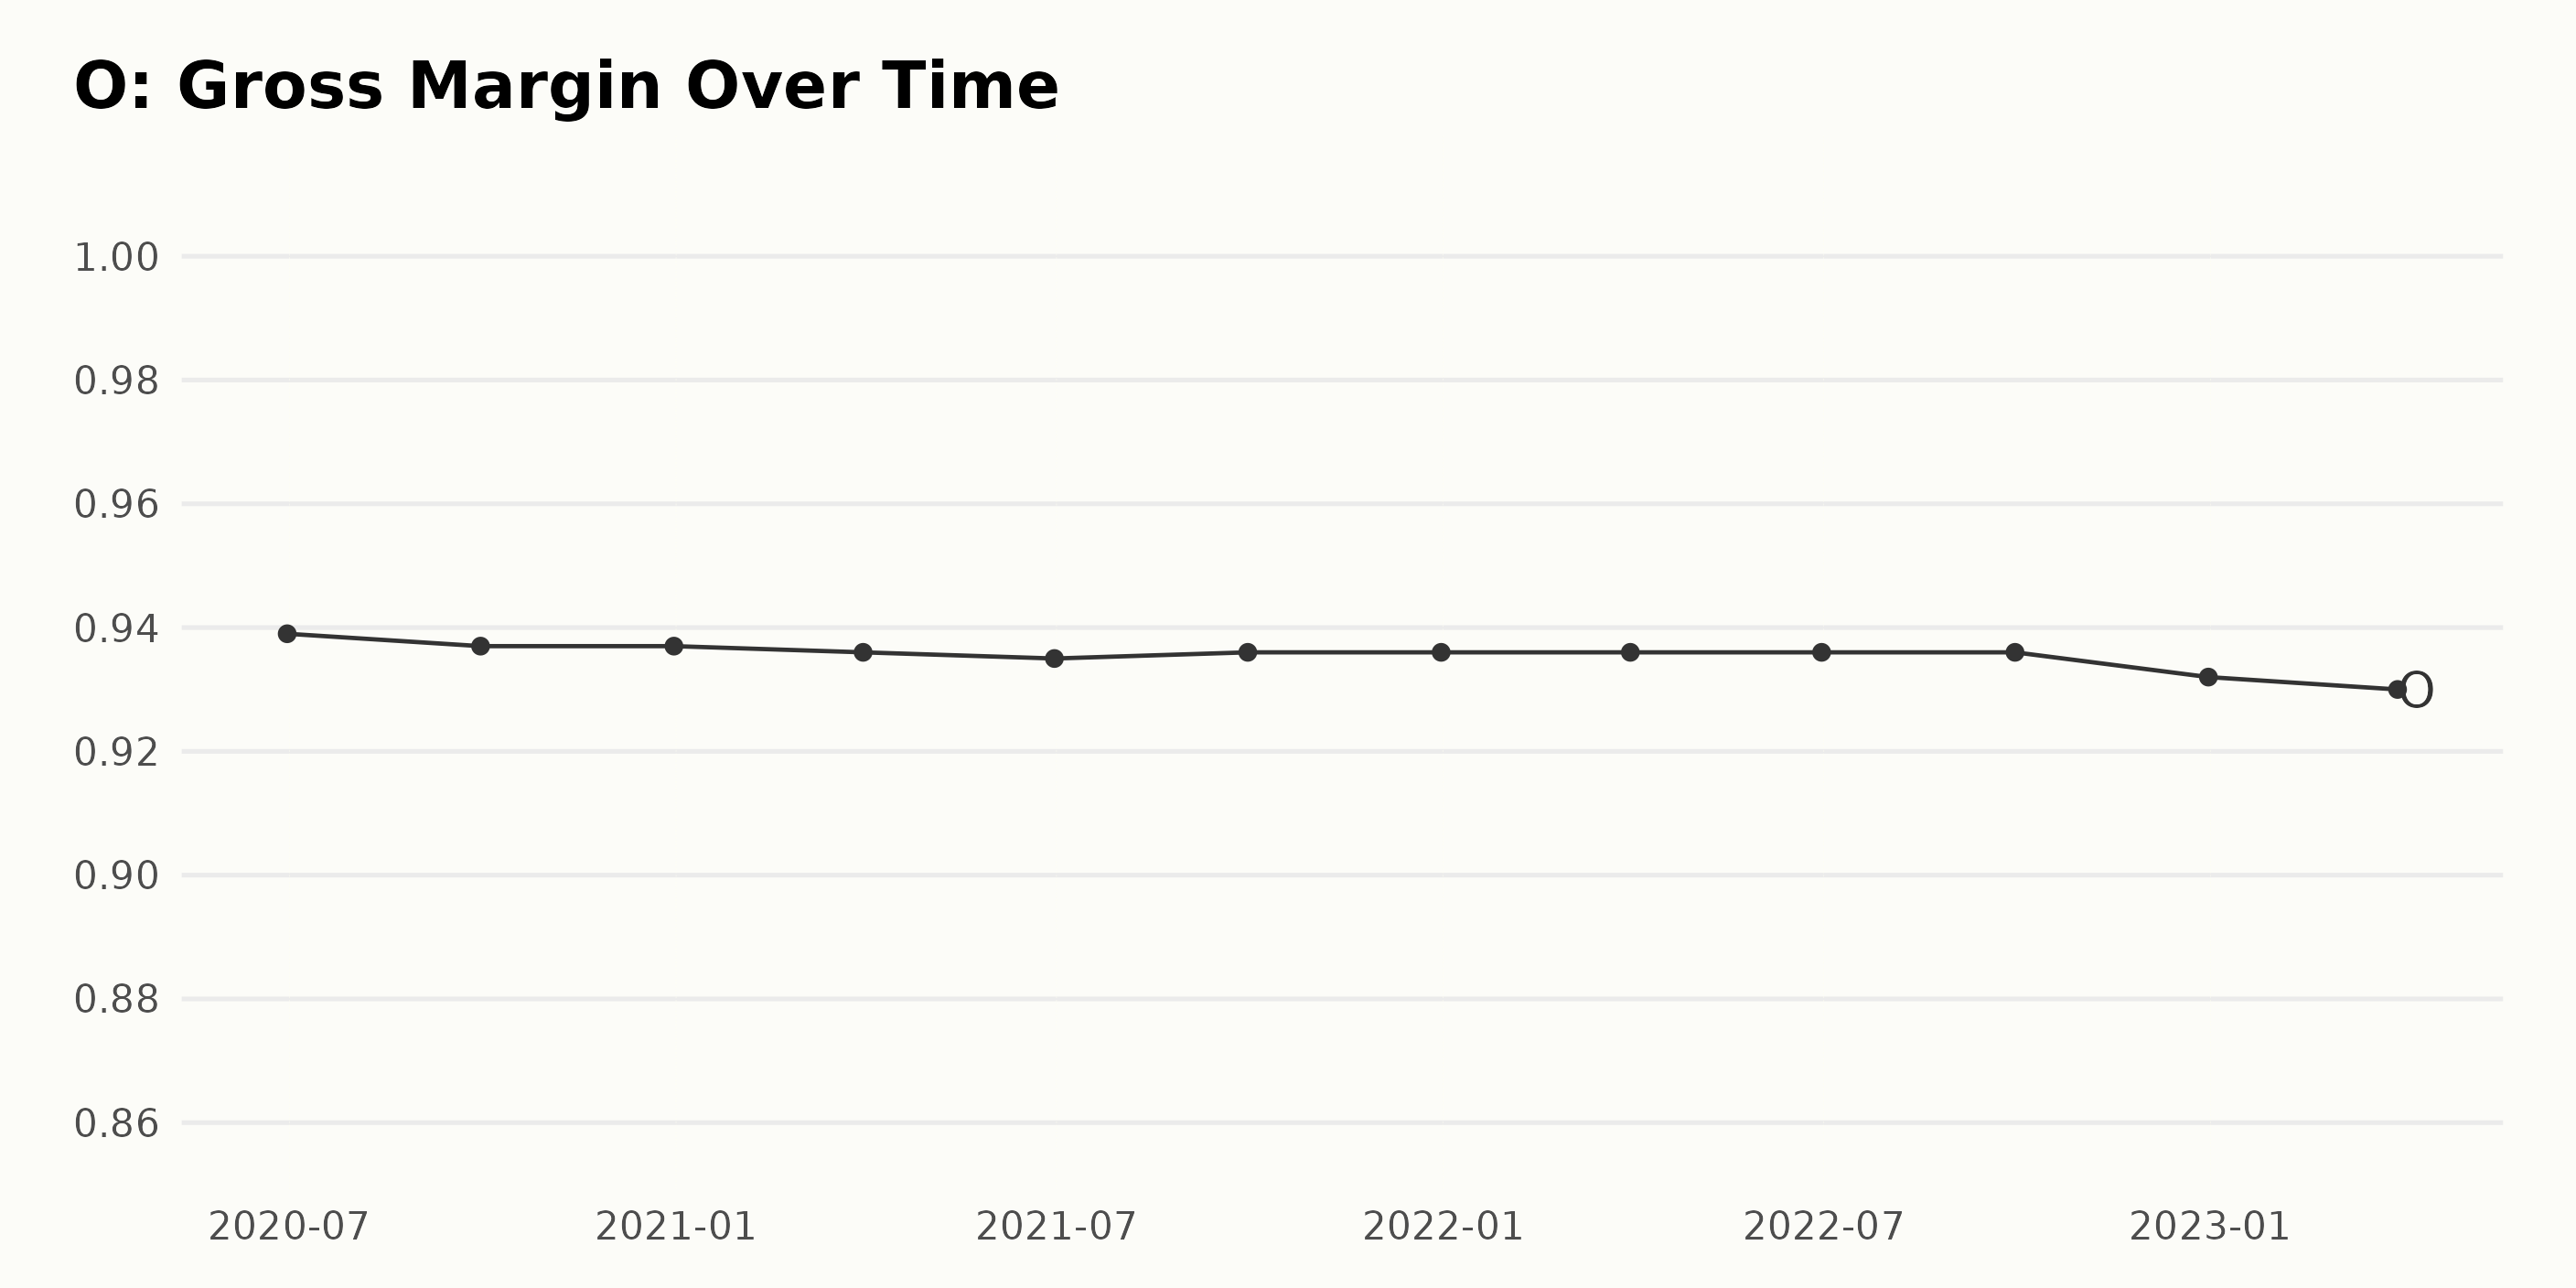
The following data presents the trend and fluctuations in O's gross margin from June 2020 to March 2023:
- June 2020: 93.90%
- September 2020: 93.70%
- December 2020: 93.70%
- March 2021: 93.60%
- June 2021: 93.50%
- September 2021: 93.60%
- December 2021: 93.60%
- March 2022: 93.60%
- June 2022: 93.60%
- September 2022: 93.60%
- December 2022: 93.20%
- March 2023: 93.00%
Overall, O's gross margin has shown a slight downward trend with minor fluctuations from June 2020 to March 2023. It has decreased from 93.90% in June 2020 to 93.00% in March 2023, representing a decline of 90 basis points during this period. The most recent value reported is 93.00% for March 2023.
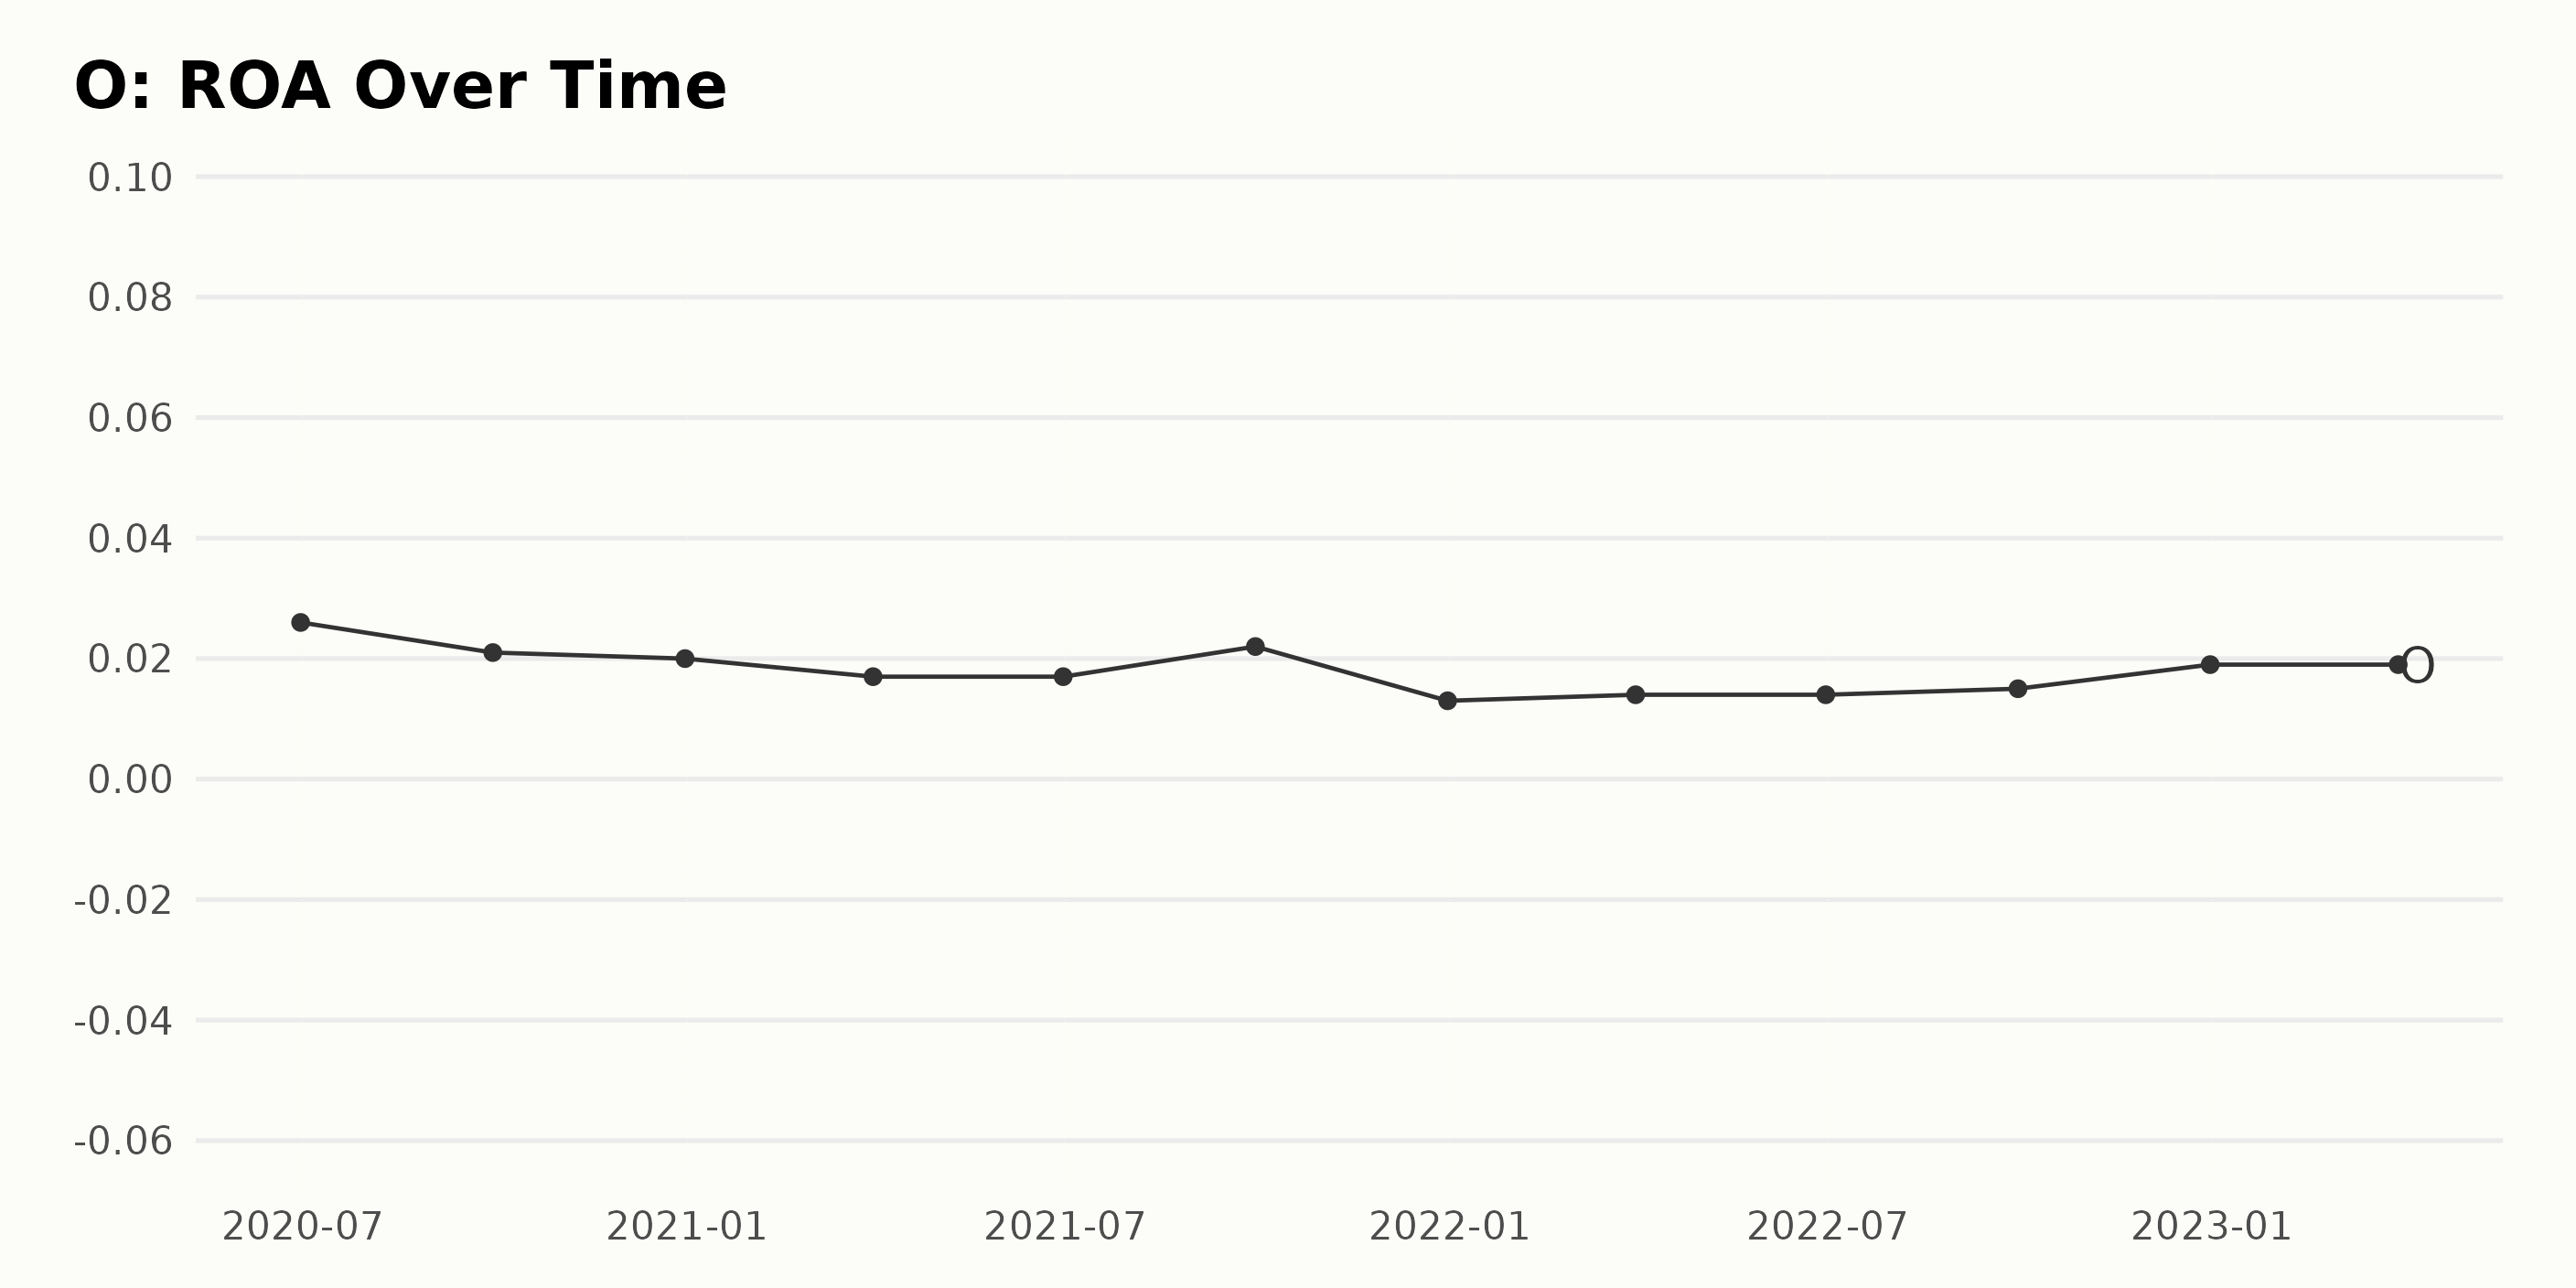
O has experienced some fluctuations in its Return On Assets (ROA) in recent years. Here is a summary of the data provided:
- June 2020: 2.6%
- September 2020: 2.1%
- December 2020: 2.0%
- March 2021: 1.7%
- June 2021: 1.7%
- September 2021: 2.2%
- December 2021: 1.3%
- March 2022: 1.4%
- June 2022: 1.4%
- September 2022: 1.5%
- December 2022: 1.9%
- March 2023: 1.9%
The trend shows a decline in ROA from June 2020 to December 2021, with some recovery observed from March 2022 onwards. The growth rate between the first value (June 2020) and the last value (March 2023) is -26.9%. The most recent ROA as of March 2023 is 1.9%.
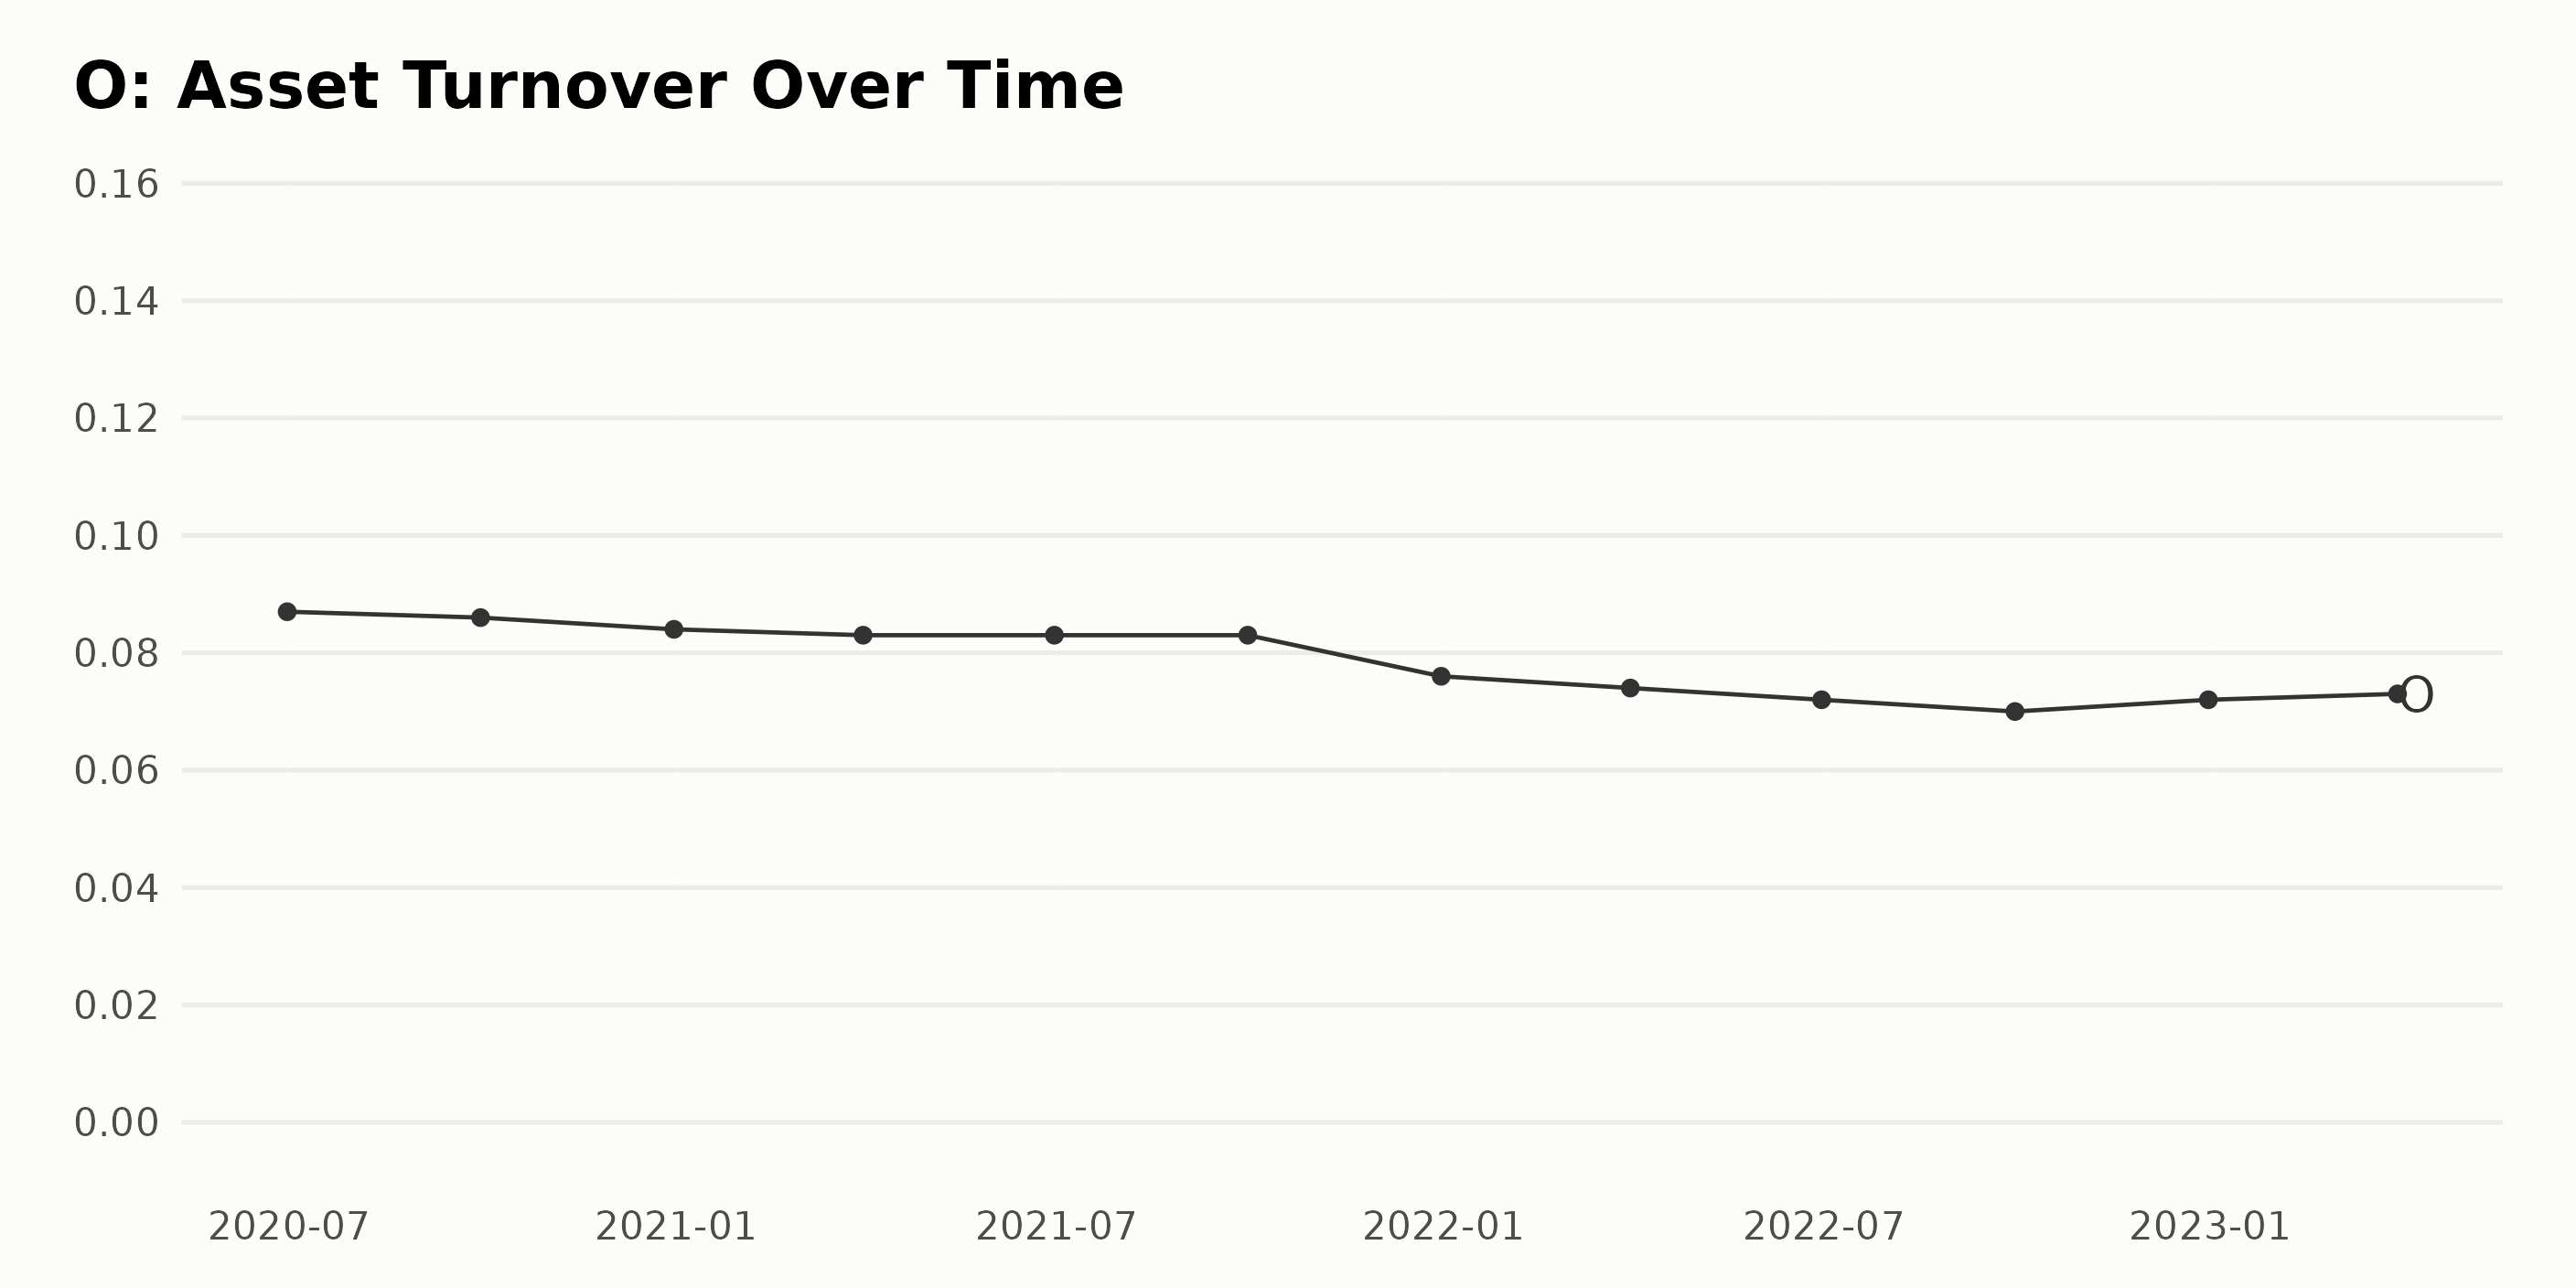
The asset turnover of O has shown a general downward trend between June 2020 and March 2023. Here is the summary of the trend and fluctuations:
- June 2020: 0.087
- September 2020: 0.086
- December 2020: 0.084
- March 2021: 0.083
- June 2021: 0.083 (consistently stable)
- September 2021: 0.083 (consistently stable)
- December 2021: 0.076
- March 2022: 0.074
- June 2022: 0.072
- September 2022: 0.07
- December 2022: 0.072 (slight increase)
- March 2023: 0.073 (further increase)
The latest data for O's asset turnover (March 2023) stands at 0.073, which indicates an increase in the recent periods (from December 2022). The growth rate from June 2020 to March 2023 represents a decrease of 16.09%.
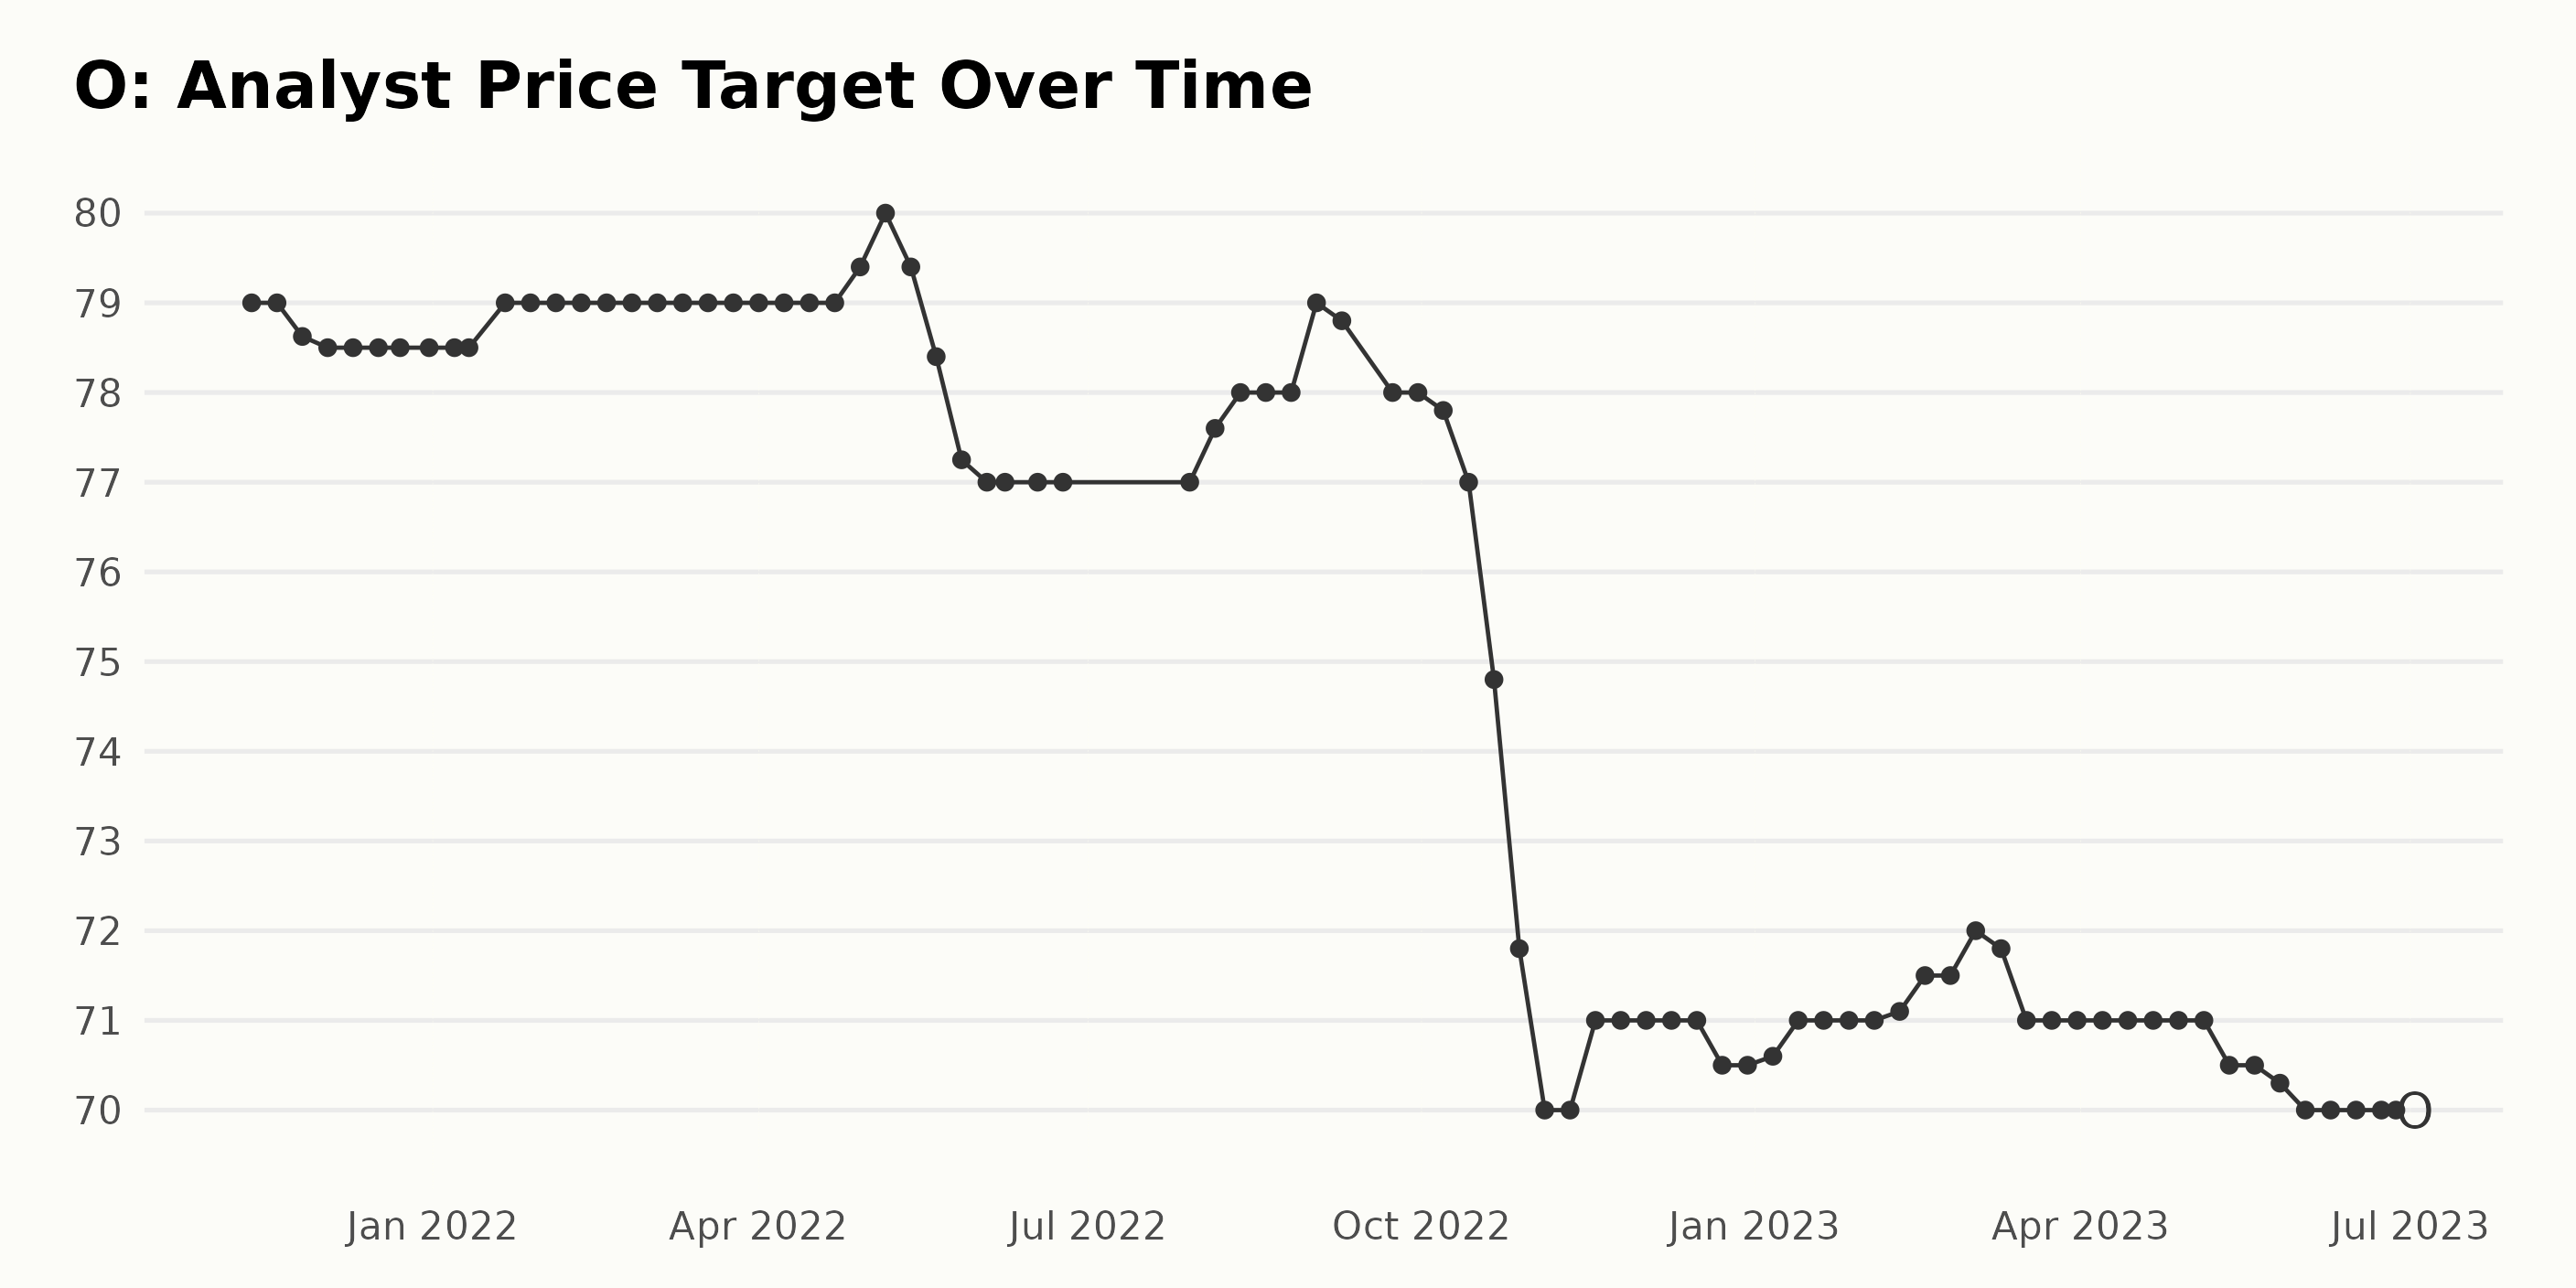
O’s analyst price target data shows a certain degree of fluctuation over the last few years. Notably:
- Starting from $79 in November 2021, the price target experienced minor fluctuations throughout 2021 and until mid-May 2022, mostly settling around $78-$80.
- A declining trend can be observed between mid-May 2022 and November 2022, where the analyst price target started at $79.4 and dropped to $70, representing a decrease of about 11.9%.
- From November 2022 onwards, fluctuations remained minor, with values mostly fluctuating between $70 and $71.5.
In conclusion, the recent trend in the analyst price target seems relatively stable, mostly ranging between $70 and $71.5 in the past few months. Over the entire period from November 2021 to June 2023, there has been an overall decline of about 11.4%, with the initial value at $79 and the final value at $70.
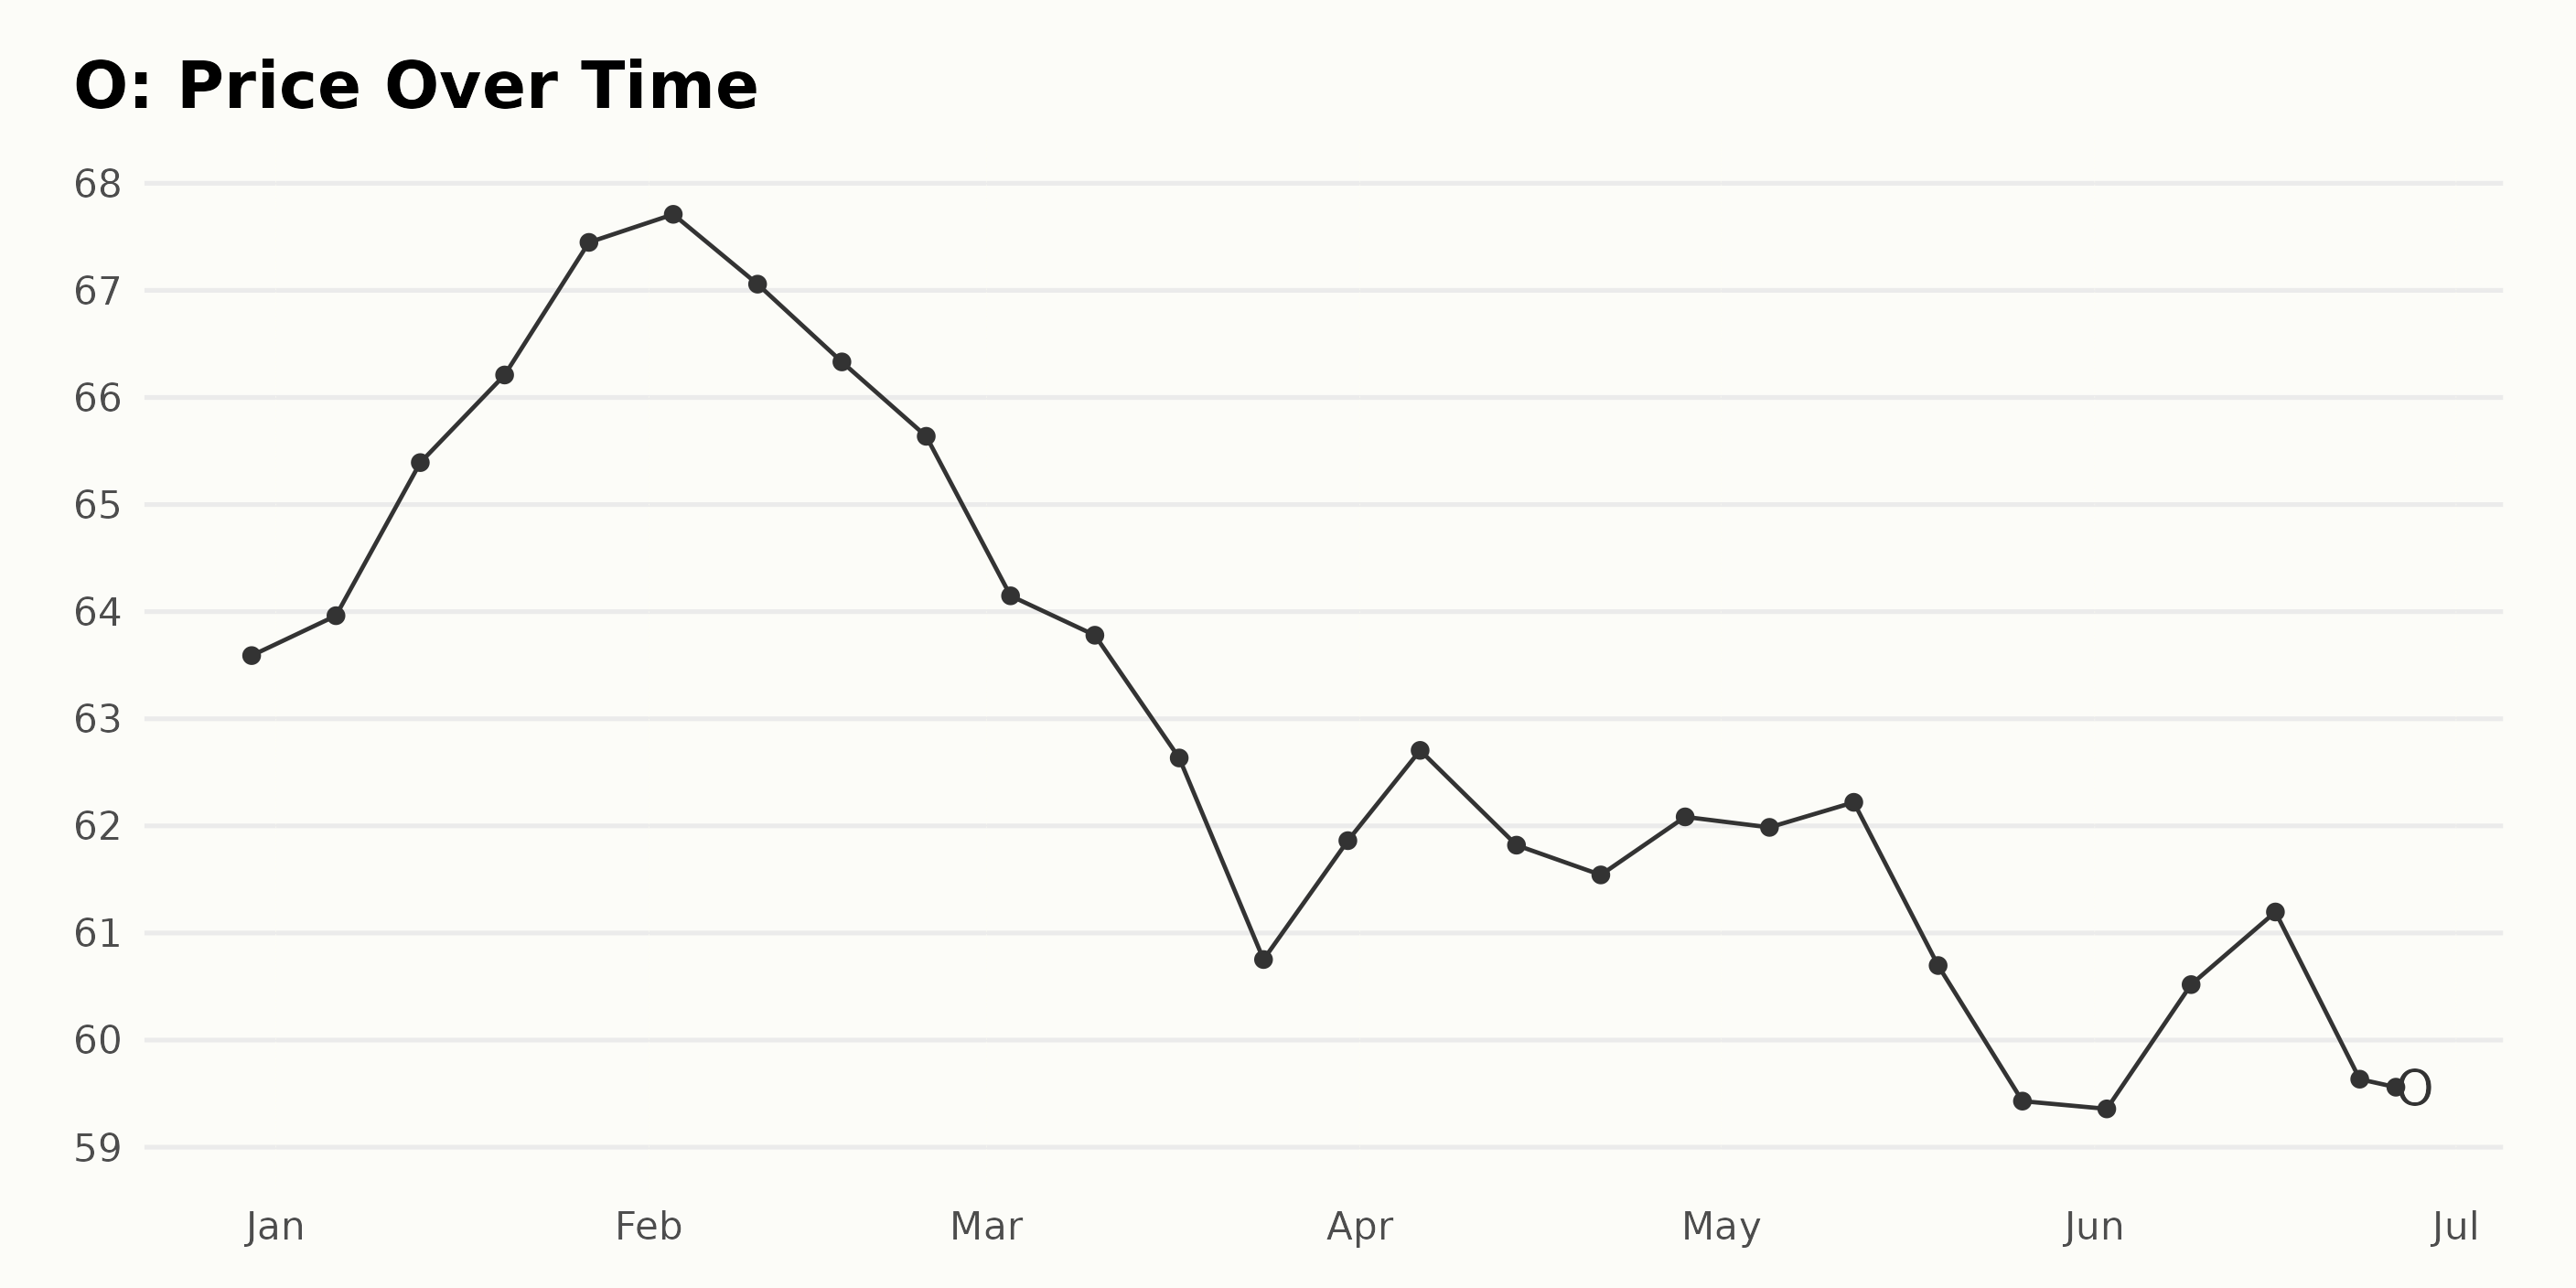
Analyzing Realty Income Corp's Share Price Trends and Fluctuations
The share prices show an initial upward trend from December 30, 2022, to February 3, 2023, with a peak price of $67.71. After this peak, the share prices experienced a downward trend, reaching a low point of $59.43 on May 26, 2023.
Toward the end of the given period, there is some fluctuation around $60. The overall trend presents a deceleration in growth rate as the share prices gradually decrease after the peak. Here is a chart of O's price over the past 180 days.
Analyzing Realty Income Corporation's Growth, Quality, and Momentum Trends
The latest overall POWR Ratings grade for O is D (Sell), with a rank of #25 within the F-rated REITs - Retail industry comprising 30 stocks as of June 27, 2023. The stock's performance has declined from a grade of C (Neutral) to D (Sell) over the period provided. Data Highlights:
- Best Rank: 20th in the category (Weeks: January 7, February 25)
- Worst Rank: 26th in the category (Week: May 6)
- Latest Rank: 25th in the category (Week: June 24)
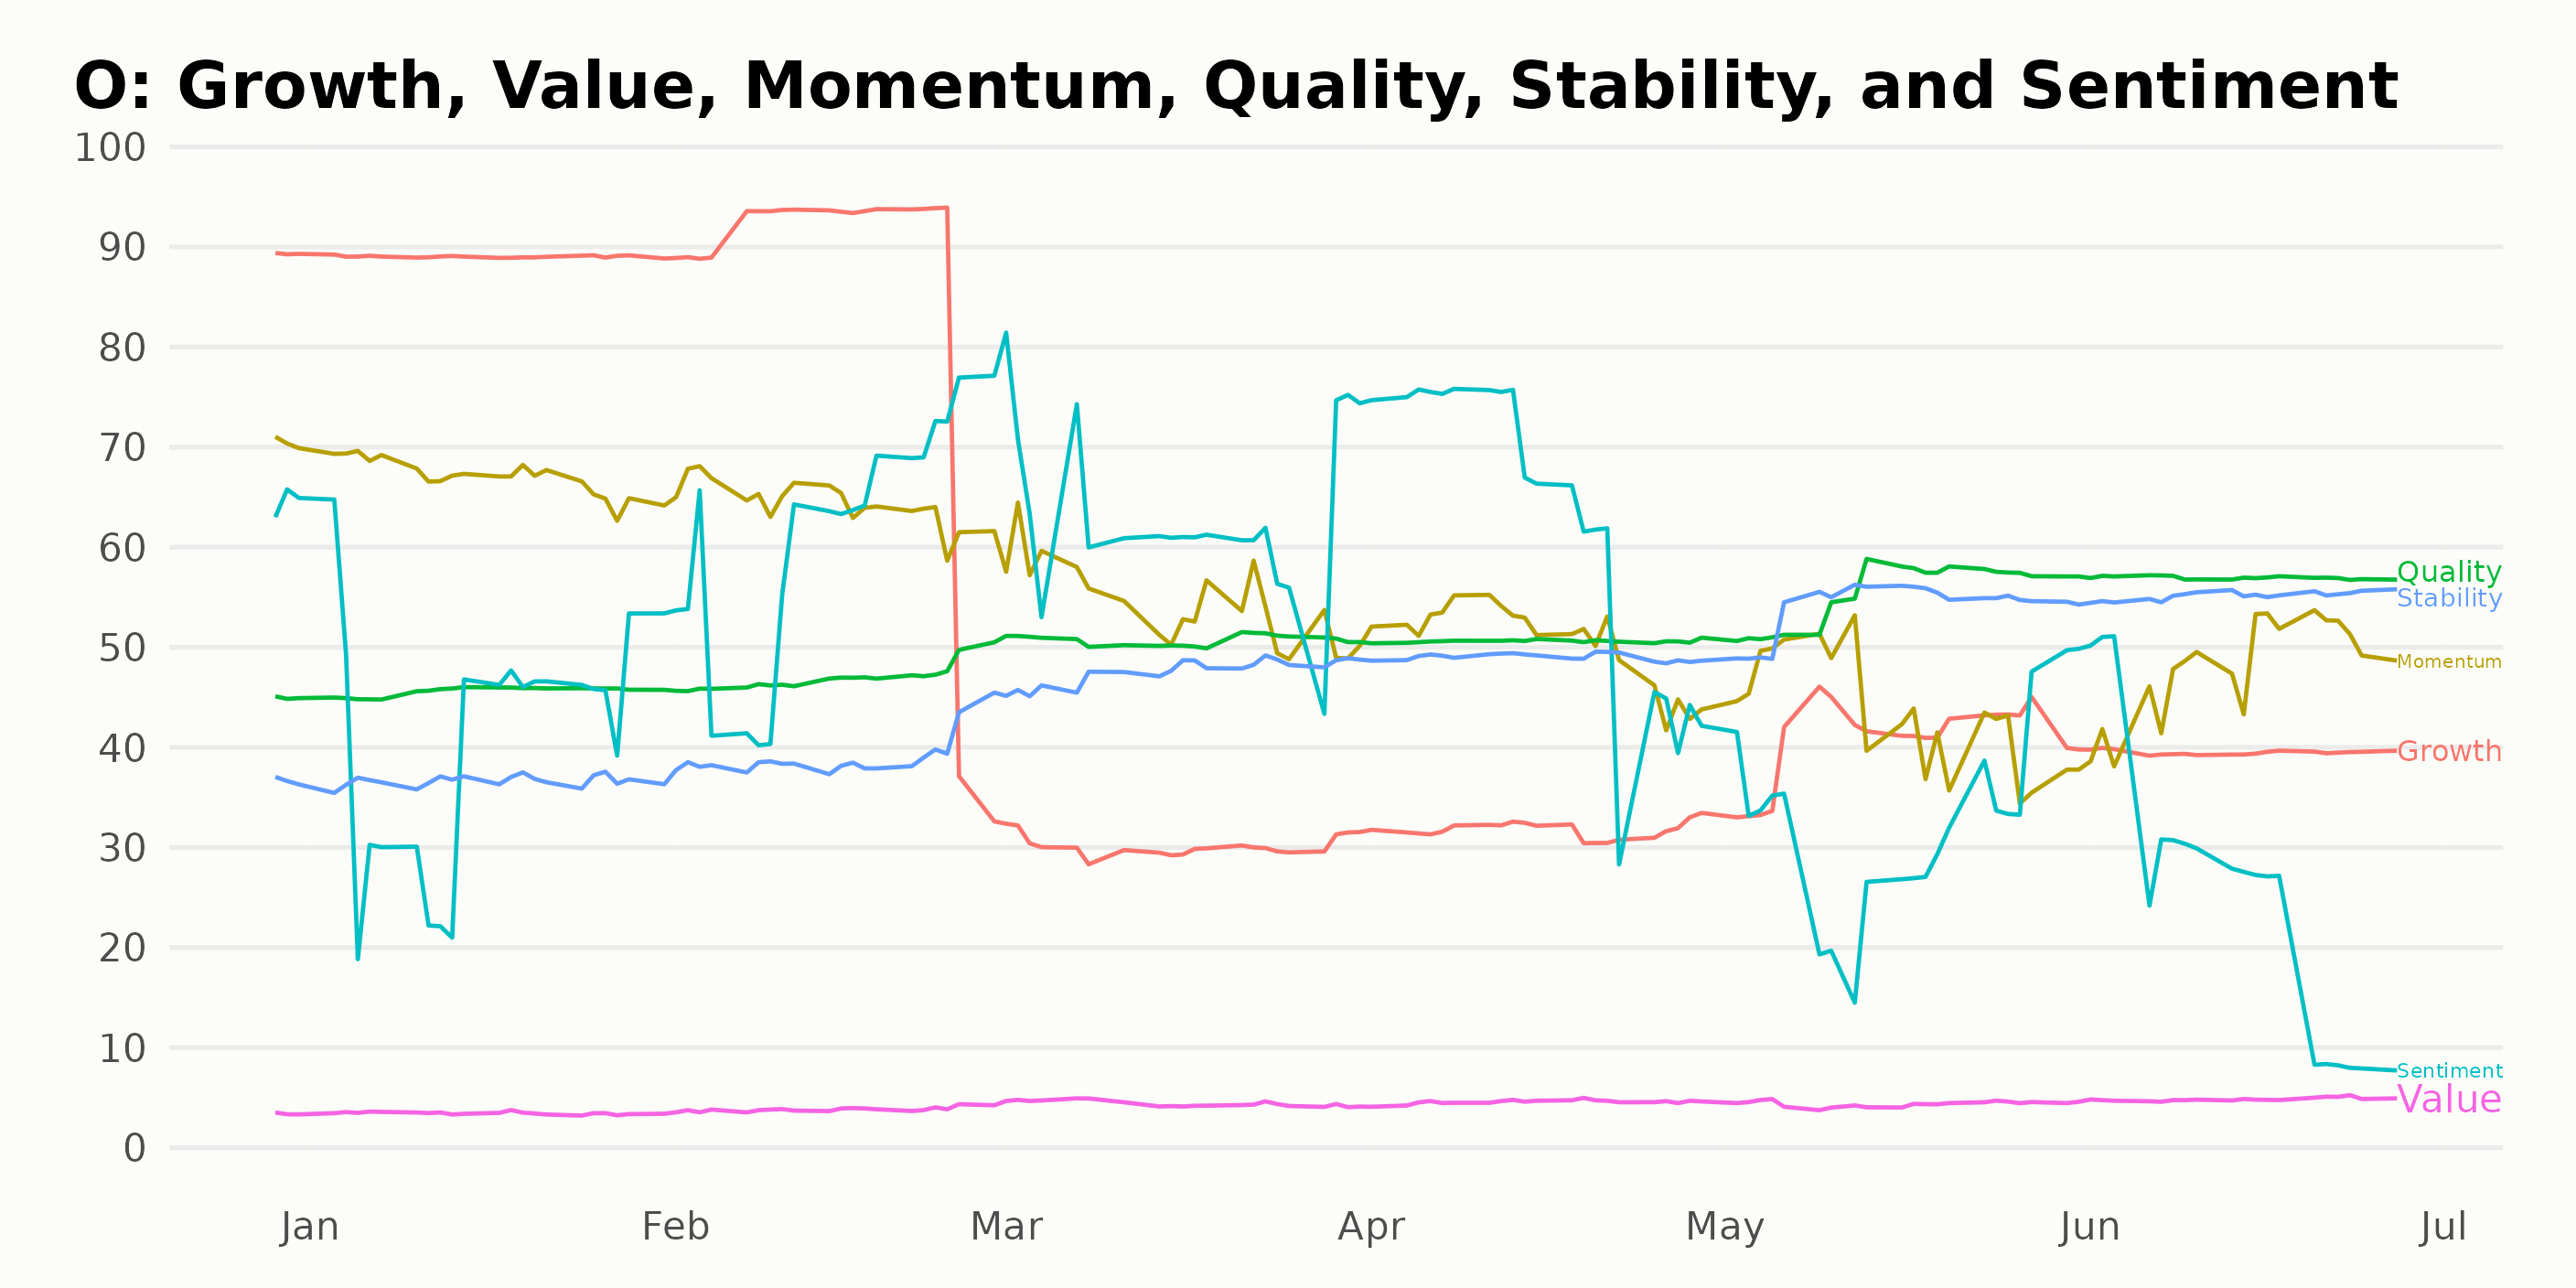
In the POWR Ratings for O, the three most noteworthy dimensions are Growth, Quality, and Momentum. Here's a breakdown of these dimensions:
Growth:
- December 31, 2022: 89
- January 31, 2023: 89
- February 28, 2023: 87
- March 31, 2023: 30
- April 29, 2023: 32
- May 31, 2023: 41
- June 24, 2023: 39
There is a clear trend in the Growth dimension: it remains high from December 2022 to February 2023 but experiences a notable decline by March 2023.
Quality:
- December 31, 2022: 45
- January 31, 2023: 46
- February 28, 2023: 47
- March 31, 2023: 51
- April 29, 2023: 51
- May 31, 2023: 55
- June 24, 2023: 57
The Quality dimension maintains a steady upward trend from December 2022 to June 2023.
Momentum:
- December 31, 2022: 70
- January 31, 2023: 67
- February 28, 2023: 64
- March 31, 2023: 54
- April 29, 2023: 50
- May 31, 2023: 43
- June 24, 2023: 48
Momentum has a mostly downward trend from December 2022 to May 2023, with a slight increase in June 2023.
How Does Realty Income Corporation (O) Stack Up Against its Peers?
Other REITs that may be worth considering are Alliance Global Group, Inc. (ALGGY), CoreCivic, Inc. (CXW), and Daito Trust Construction Co., Ltd. (DIFTY) - they have better POWR Ratings.
What To Do Next?
Discover 10 widely held stocks that our proprietary model shows have tremendous downside potential. Please make sure none of these “death trap” stocks are lurking in your portfolio:
O shares were trading at $60.04 per share on Tuesday morning, up $0.09 (+0.15%). Year-to-date, O has declined -3.42%, versus a 14.43% rise in the benchmark S&P 500 index during the same period.
About the Author: Anushka Dutta

Anushka is an analyst whose interest in understanding the impact of broader economic changes on financial markets motivated her to pursue a career in investment research.
The post Is Realty Income (O) a Good Buy for the End of June? appeared first on StockNews.com