What a brutal six months it’s been for Strategy. The stock has dropped 24.5% and now trades at $97.08, rattling many shareholders. This was partly due to its softer quarterly results and might have investors contemplating their next move.
Is there a buying opportunity in Strategy, or does it present a risk to your portfolio? Get the full breakdown from our expert analysts, it’s free.
Why Do We Think Strategy Will Underperform?
Even though the stock has become cheaper, we’re sitting this one out for now. Here are three reasons you should be careful with MSTR, plus one stock we’d rather own.
Note that our analysis is rooted in fundamentals, not Bitcoin-driven technicals.
1. Weak Billings Point to Soft Demand
Billings is a non-GAAP metric that is often called “cash revenue” because it shows how much money the company has collected from customers in a certain period. This is different from revenue, which must be recognized in pieces over the length of a contract.
Strategy’s billings came in at $112 million in Q2, and over the last four quarters, its year-on-year growth averaged 6.6%. This performance was underwhelming and suggests that increasing competition is causing challenges in acquiring/retaining customers. 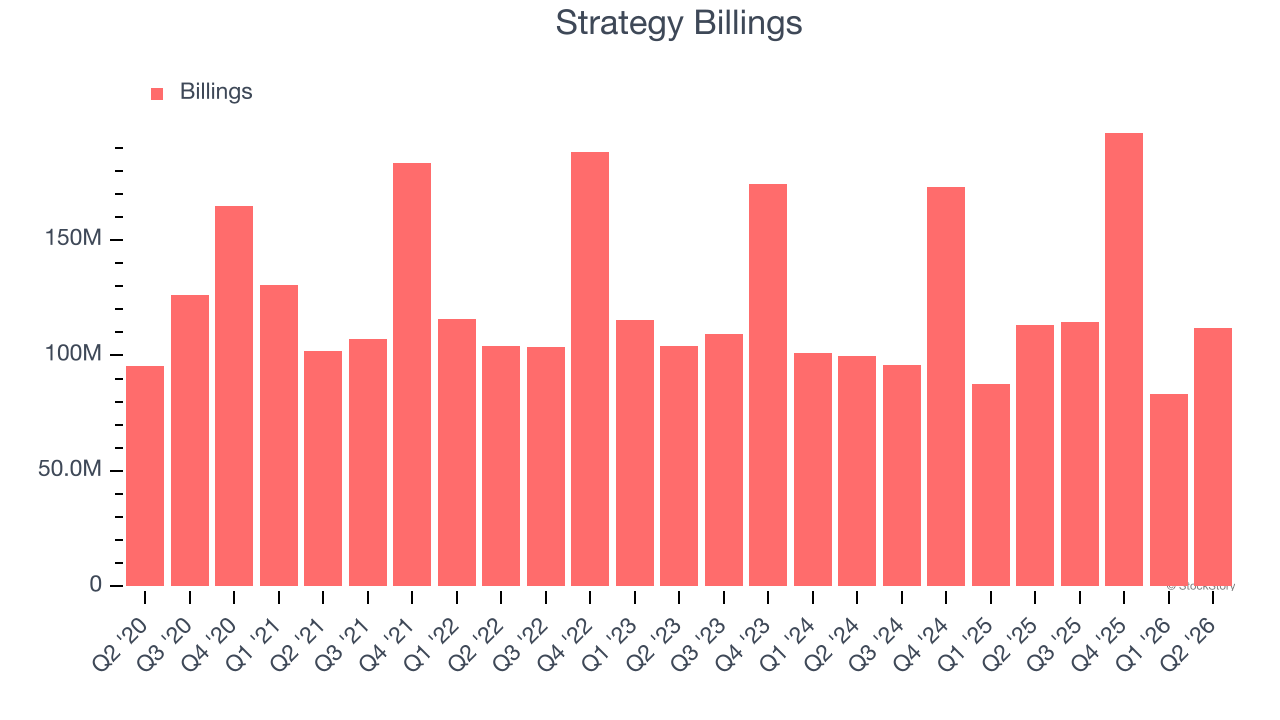
2. Shrinking Operating Margin
Many software businesses adjust their profits for stock-based compensation (SBC), but we prioritize GAAP operating margin because SBC is a real expense used to attract and retain engineering and sales talent. This metric shows how much revenue remains after accounting for all core expenses — everything from the cost of goods sold to sales and R&D.
Looking at the trend in its profitability, Strategy’s operating margin decreased significantly over the last two years. Strategy’s performance was poor no matter how you look at it - largely due to unrealized losses on its digital assets. Its operating margin for the trailing 12 months was negative 7,295%.
3. Cash Burn Ignites Concerns
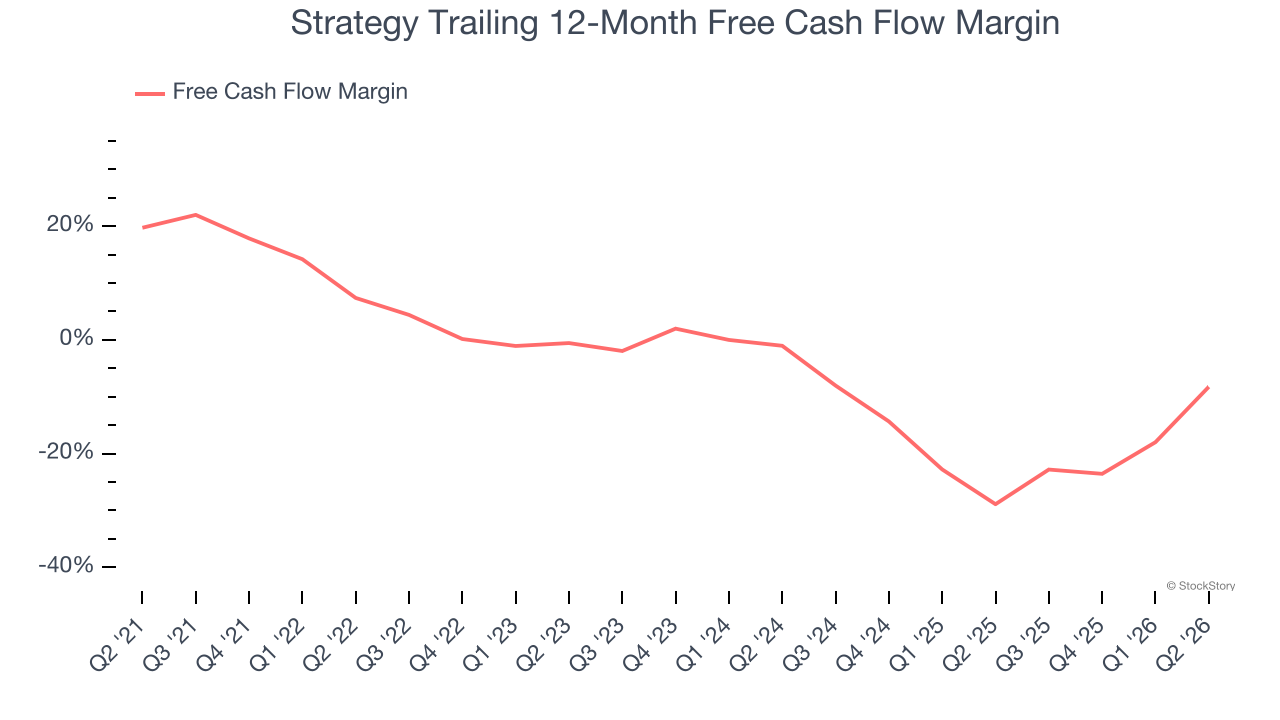
Free cash flow isn’t a prominently featured metric in company financials and earnings releases, but we think it’s telling because it accounts for all operating and capital expenses, making it tough to manipulate. Cash is king.
Strategy’s demanding reinvestments have drained its resources over the last year, putting it in a pinch and limiting its ability to return capital to investors. Its free cash flow margin averaged negative 8.3%, meaning it lit $8.27 of cash on fire for every $100 in revenue.
Final Judgment
Strategy falls short of our quality standards. After the recent drawdown, the stock trades at 66.3× forward price-to-sales (or $97.08 per share). This valuation tells us it’s a bit of a market darling with a lot of good news priced in - you can find more timely opportunities elsewhere. We’d suggest looking at a top digital advertising platform riding the creator economy.
Stocks We Would Buy Instead of Strategy
ALSO WORTH WATCHING: Top 5 Momentum Stocks. The best time to own a great stock is when the market is finally noticing it. These aren’t just high-quality businesses. Something is happening with them right now. Elite fundamentals meet near-term momentum — both boxes checked at the same time.
Find out which stocks our AI platform is flagging this week. See this week’s Strong Momentum stocks — FREE. Get Our Strong Momentum Stocks for Free HERE.
Stocks that have made our list include now familiar names such as Nvidia (+1,460% between June 2020 and June 2025) as well as under-the-radar businesses like the once-micro-cap company Kadant (+214% between June 2020 and June 2025). Find your next big winner with StockStory today.