
3D printing company 3D Systems (NYSE: DDD) reported Q1 CY2026 results beating Wall Street’s revenue expectations, with sales up 1.1% year on year to $95.54 million. Its GAAP loss of $0.03 per share was 72.7% above analysts’ consensus estimates.
Is now the time to buy 3D Systems? Find out by accessing our full research report, it’s free.
3D Systems (DDD) Q1 CY2026 Highlights:
- Revenue: $95.54 million vs analyst estimates of $92.2 million (1.1% year-on-year growth, 3.6% beat)
- EPS (GAAP): -$0.03 vs analyst estimates of -$0.11 (72.7% beat)
- Adjusted EBITDA: $774,000 (0.8% margin, 103% year-on-year growth)
- Adjusted EBITDA Margin: 0.8%, up from -24.1% in the same quarter last year
- Free Cash Flow was -$9.27 million compared to -$36.58 million in the same quarter last year
- Market Capitalization: $360.8 million
Company Overview
Founded by the inventor of stereolithography, 3D Systems (NYSE: DDD) engineers, manufactures, and sells 3D printers and other related products to the aerospace, automotive, healthcare, and consumer goods industries.
Revenue Growth
A company’s long-term sales performance is one signal of its overall quality. Any business can put up a good quarter or two, but many enduring ones grow for years. 3D Systems’s demand was weak over the last five years as its sales fell at a 7.3% annual rate. This was below our standards and is a sign of poor business quality.
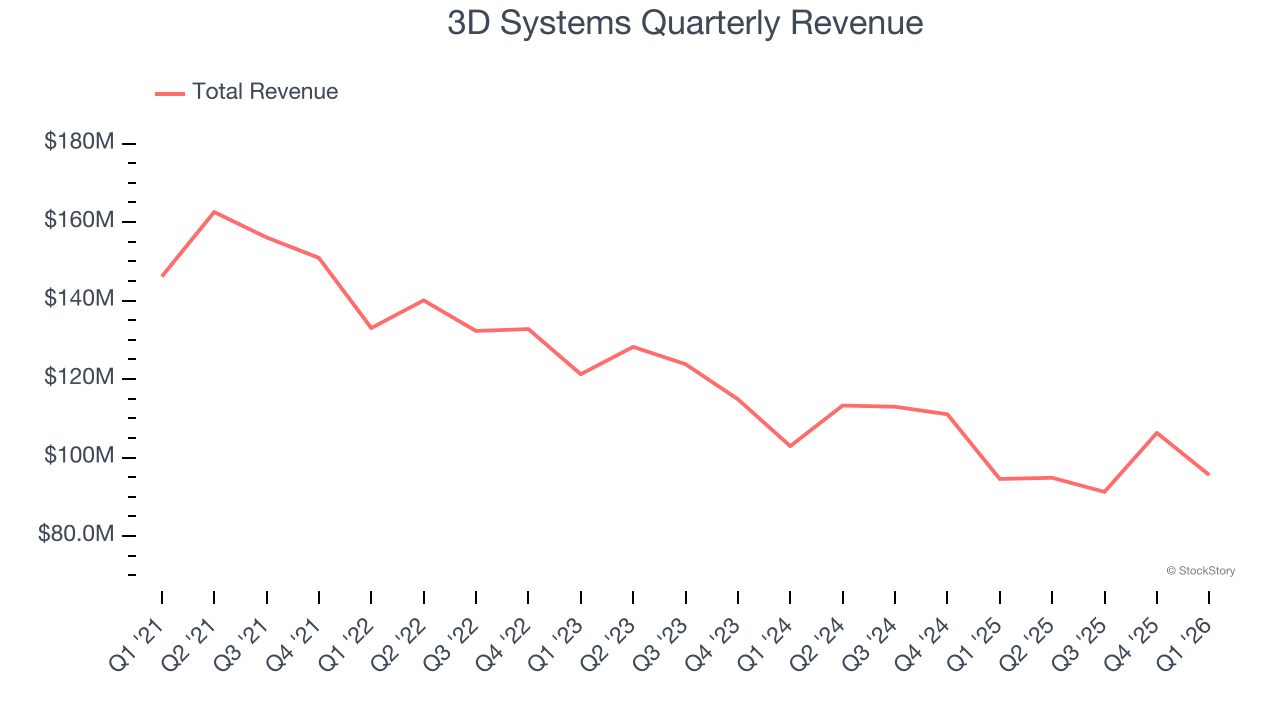
We at StockStory place the most emphasis on long-term growth, but within industrials, a half-decade historical view may miss cycles, industry trends, or a company capitalizing on catalysts such as a new contract win or a successful product line. 3D Systems’s recent performance shows its demand remained suppressed as its revenue has declined by 9.1% annually over the last two years. 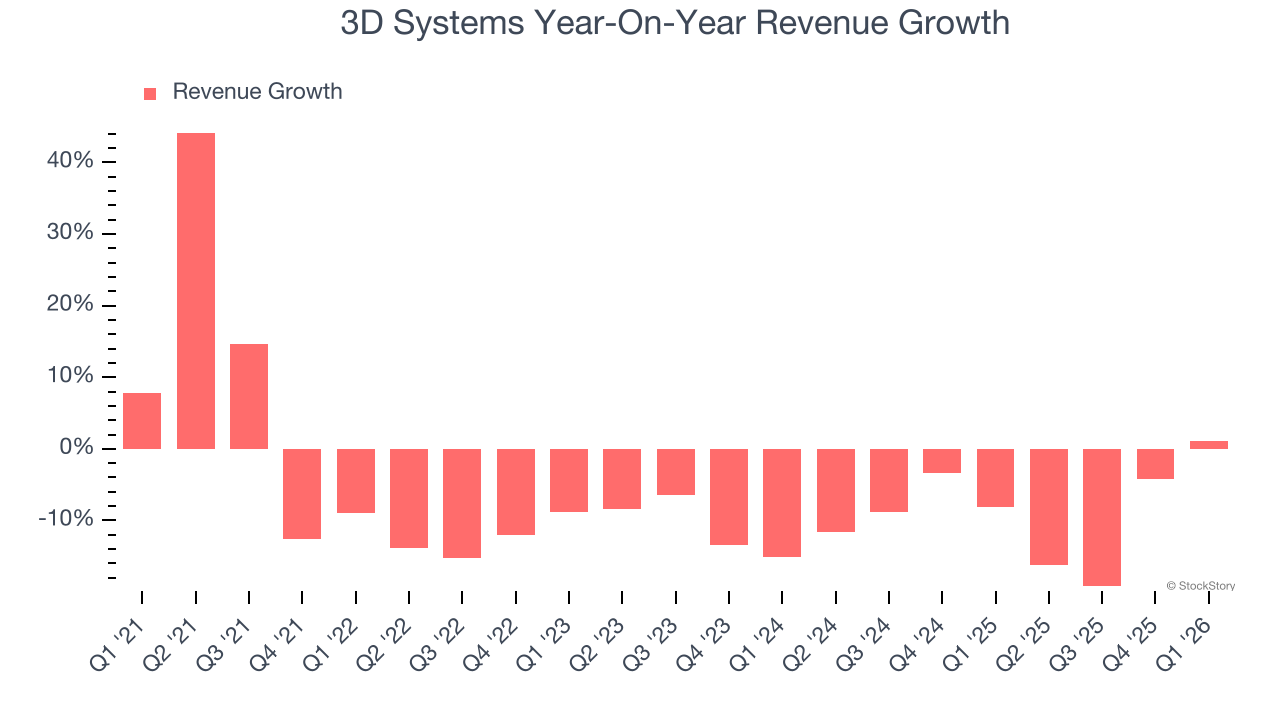
We can better understand the company’s revenue dynamics by analyzing its most important segments, Industrial and Healthcare, which are 47.5% and 52.5% of revenue. Over the last two years, 3D Systems’s Industrial revenue (aerospace, defense, and transportation manufacturing) averaged 6.5% year-on-year declines while its Healthcare revenue (dental and medical devices) averaged 4.8% declines. 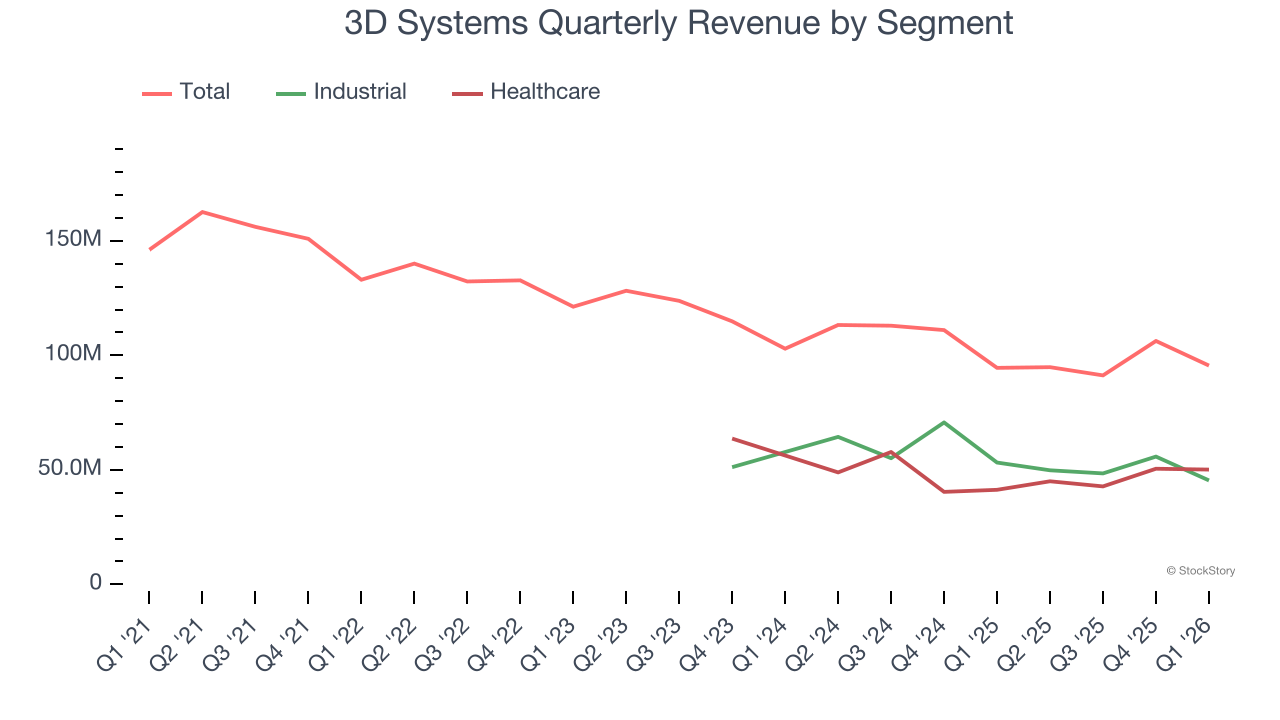
This quarter, 3D Systems reported modest year-on-year revenue growth of 1.1% but beat Wall Street’s estimates by 3.6%.
Looking ahead, sell-side analysts expect revenue to grow 2% over the next 12 months. Although this projection suggests its newer products and services will fuel better top-line performance, it is still below the sector average.
ALSO WORTH WATCHING: Nvidia’s Quiet Partner. Nvidia’s chips cost a hundred grand. The connectors that make them work cost even more. One company makes them all.
Every AI server needs specialized infrastructure the chip companies don’t make. High-speed cables. Power connectors. Thermal sensors. This 90-year-old company built a monopoly on it. The AI boom just started. This stock is still flying under the radar. Claim The Stock Ticker Here for FREE.
Operating Margin
Operating margin is a key measure of profitability. Think of it as net income - the bottom line - excluding the impact of taxes and interest on debt, which are less connected to business fundamentals.
3D Systems’s high expenses have contributed to an average operating margin of negative 38.6% over the last five years. Unprofitable industrials companies require extra attention because they could get caught swimming naked when the tide goes out. It’s hard to trust that the business can endure a full cycle.
Analyzing the trend in its profitability, 3D Systems’s operating margin decreased by 8 percentage points over the last five years. 3D Systems’s performance was poor no matter how you look at it - it shows that costs were rising and it couldn’t pass them onto its customers.
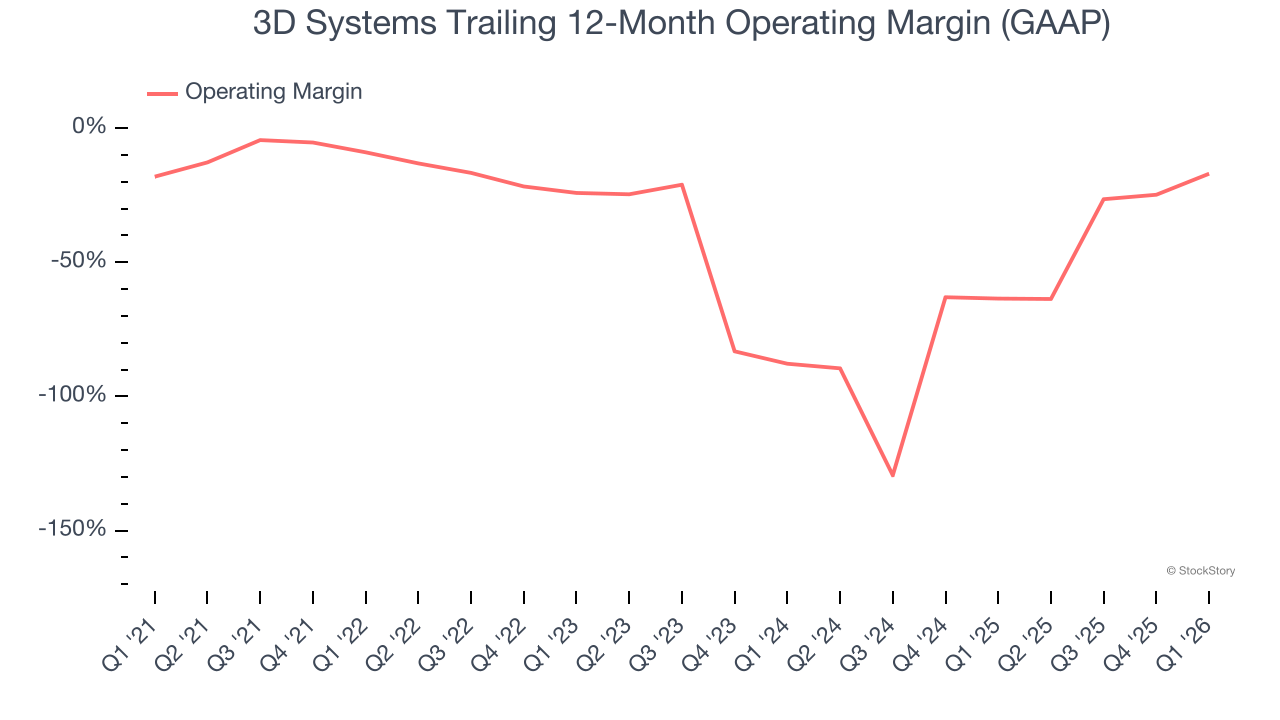
In Q1, 3D Systems generated a negative 7% operating margin. The company's consistent lack of profits raise a flag.
Earnings Per Share
We track the long-term change in earnings per share (EPS) for the same reason as long-term revenue growth. Compared to revenue, however, EPS highlights whether a company’s growth is profitable.
3D Systems’s full-year EPS flipped from negative to positive over the last five years. This is encouraging and shows it’s at a critical moment in its life.
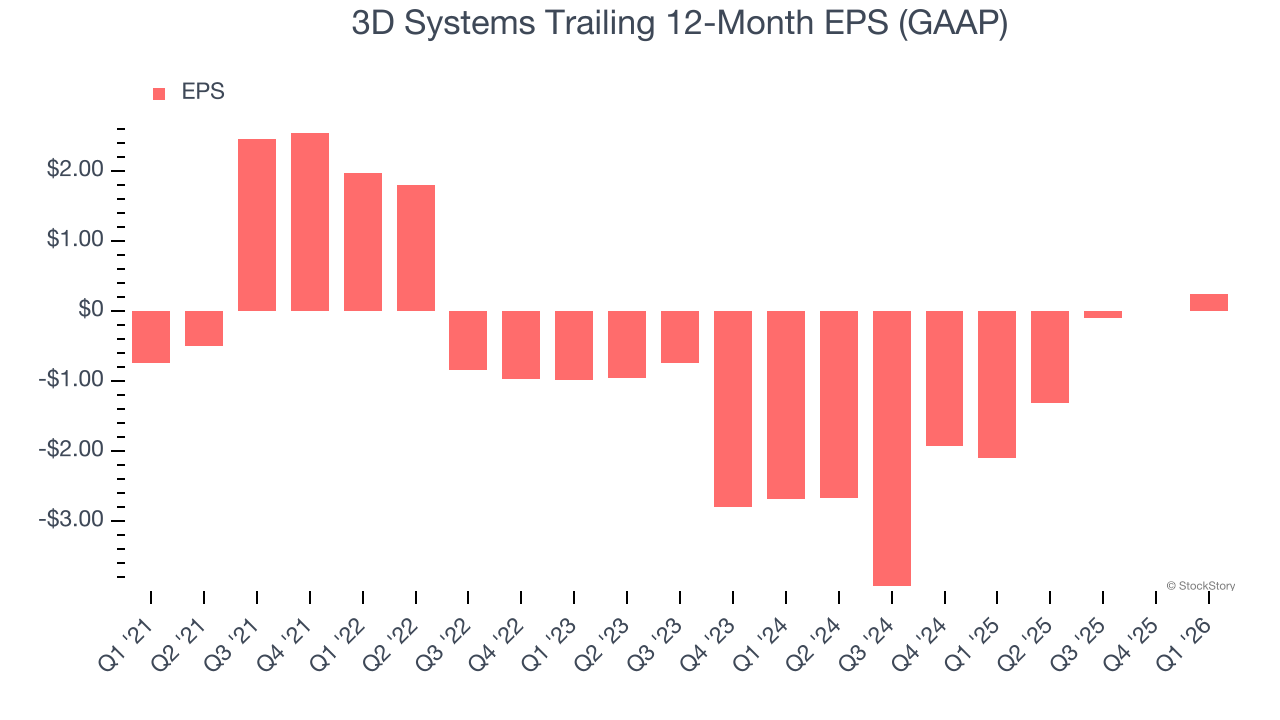
Like with revenue, we analyze EPS over a more recent period because it can provide insight into an emerging theme or development for the business.
For 3D Systems, its two-year annual EPS growth of 44.7% was higher than its five-year trend. We love it when earnings growth accelerates, especially when it accelerates off an already high base.
In Q1, 3D Systems reported EPS of negative $0.03, up from negative $0.28 in the same quarter last year. This print easily cleared analysts’ estimates, and shareholders should be content with the results. We also like to analyze expected EPS growth based on Wall Street analysts’ consensus projections, but there is insufficient data.
Key Takeaways from 3D Systems’s Q1 Results
It was good to see 3D Systems beat analysts’ EPS expectations this quarter. We were also excited its EBITDA outperformed Wall Street’s estimates by a wide margin. Zooming out, we think this quarter featured some important positives. The stock traded up 1.4% to $2.52 immediately after reporting.
Indeed, 3D Systems had a rock-solid quarterly earnings result, but is this stock a good investment here? We think that the latest quarter is only one piece of the longer-term business quality puzzle. Quality, when combined with valuation, can help determine if the stock is a buy. We cover that in our actionable full research report which you can read here (it’s free).