
Commercial asset marketplace RB Global (NYSE: RBA) reported Q4 CY2025 results beating Wall Street’s revenue expectations, with sales up 5.4% year on year to $1.20 billion. Its non-GAAP profit of $1.11 per share was 11.8% above analysts’ consensus estimates.
Is now the time to buy RB Global? Find out by accessing our full research report, it’s free.
RB Global (RBA) Q4 CY2025 Highlights:
- Revenue: $1.20 billion vs analyst estimates of $1.17 billion (5.4% year-on-year growth, 2.7% beat)
- Adjusted EPS: $1.11 vs analyst estimates of $0.99 (11.8% beat)
- Adjusted EBITDA: $379.6 million vs analyst estimates of $356.5 million (31.5% margin, 6.5% beat)
- EBITDA guidance for the upcoming financial year 2026 is $1.5 billion at the midpoint, above analyst estimates of $1.49 billion
- Operating Margin: 14.7%, down from 18.1% in the same quarter last year
- Free Cash Flow Margin: 15.5%, up from 9.5% in the same quarter last year
- Market Capitalization: $18.94 billion
Company Overview
Born from the 1958 founding of Ritchie Bros. Auctioneers and rebranded in 2023, RB Global (NYSE: RBA) operates global marketplaces that connect buyers and sellers of commercial assets, vehicles, and equipment across multiple industries.
Revenue Growth
Examining a company’s long-term performance can provide clues about its quality. Any business can put up a good quarter or two, but many enduring ones grow for years.
With $4.59 billion in revenue over the past 12 months, RB Global is one of the larger companies in the business services industry and benefits from a well-known brand that influences purchasing decisions.
As you can see below, RB Global’s 27.2% annualized revenue growth over the last five years was incredible. This is a great starting point for our analysis because it shows RB Global’s demand was higher than many business services companies.
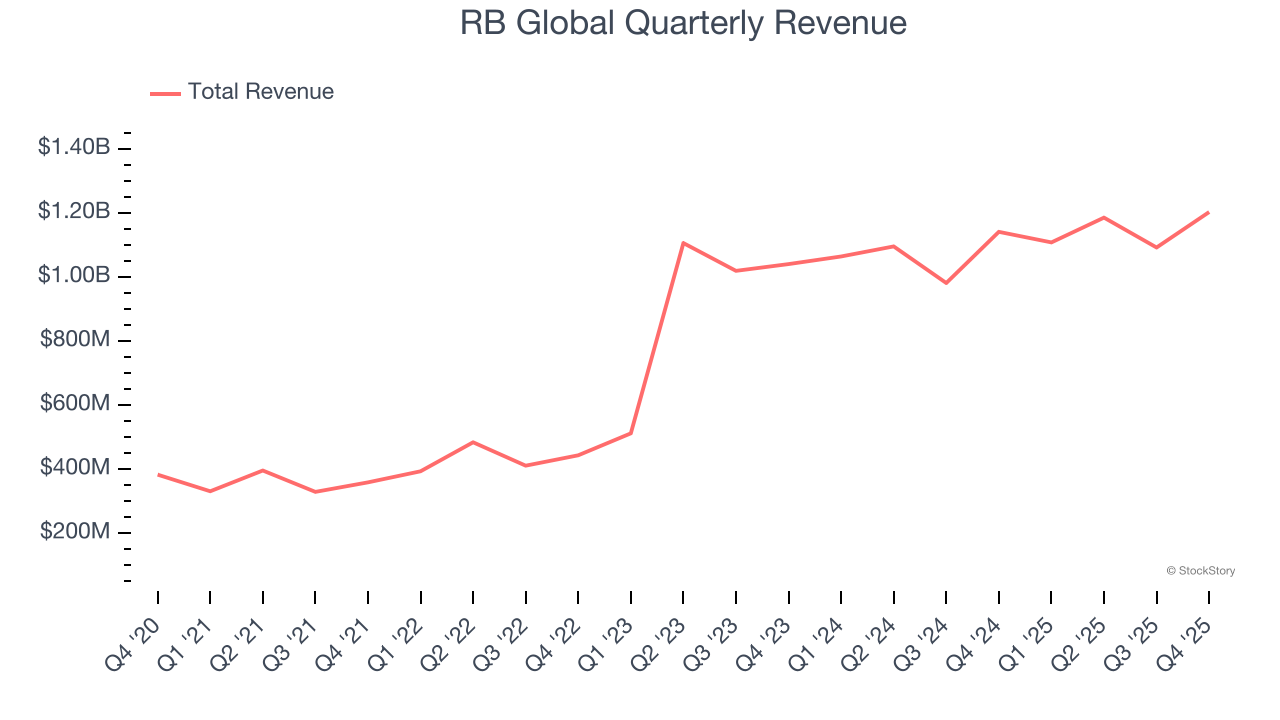
We at StockStory place the most emphasis on long-term growth, but within business services, a half-decade historical view may miss recent innovations or disruptive industry trends. RB Global’s annualized revenue growth of 11.7% over the last two years is below its five-year trend, but we still think the results suggest healthy demand. 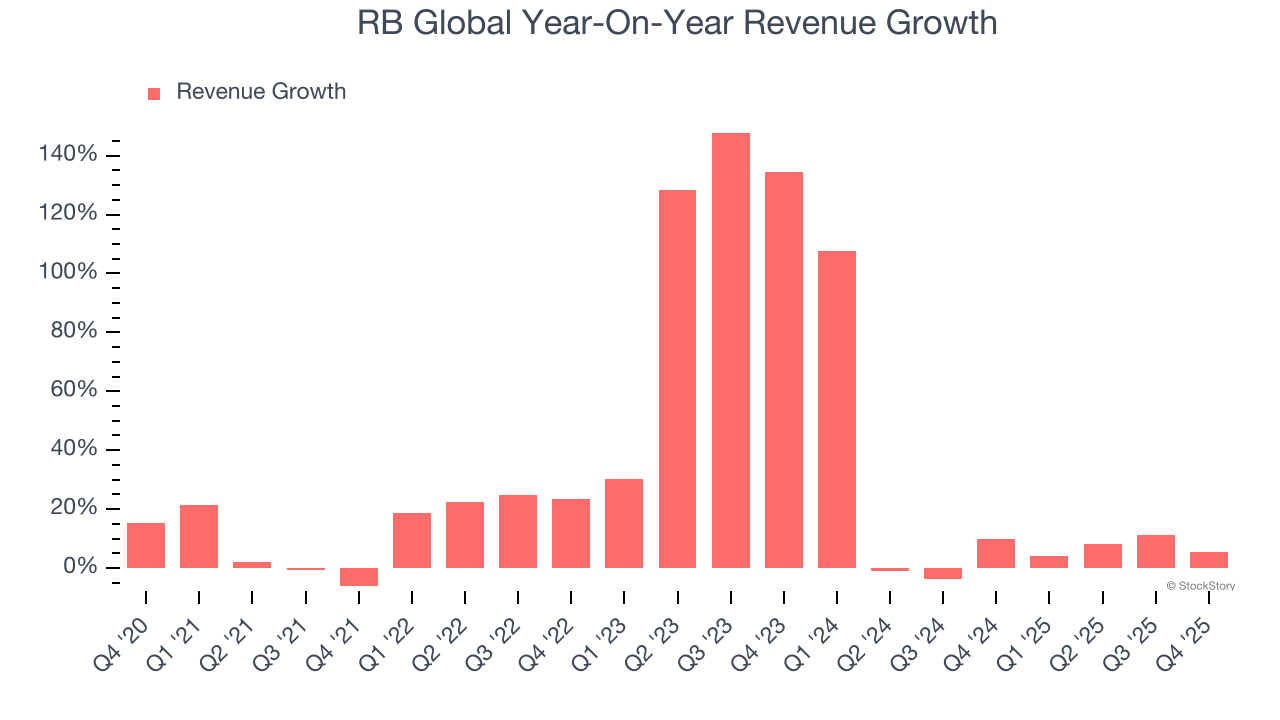
This quarter, RB Global reported year-on-year revenue growth of 5.4%, and its $1.20 billion of revenue exceeded Wall Street’s estimates by 2.7%.
Looking ahead, sell-side analysts expect revenue to grow 3.2% over the next 12 months, a deceleration versus the last two years. This projection doesn't excite us and suggests its products and services will face some demand challenges. At least the company is tracking well in other measures of financial health.
Software is eating the world and there is virtually no industry left that has been untouched by it. That drives increasing demand for tools helping software developers do their jobs, whether it be monitoring critical cloud infrastructure, integrating audio and video functionality, or ensuring smooth content streaming. Click here to access a free report on our 3 favorite stocks to play this generational megatrend.
Operating Margin
RB Global has been an efficient company over the last five years. It was one of the more profitable businesses in the business services sector, boasting an average operating margin of 16.8%.
Analyzing the trend in its profitability, RB Global’s operating margin decreased by 1.4 percentage points over the last five years. This raises questions about the company’s expense base because its revenue growth should have given it leverage on its fixed costs, resulting in better economies of scale and profitability.
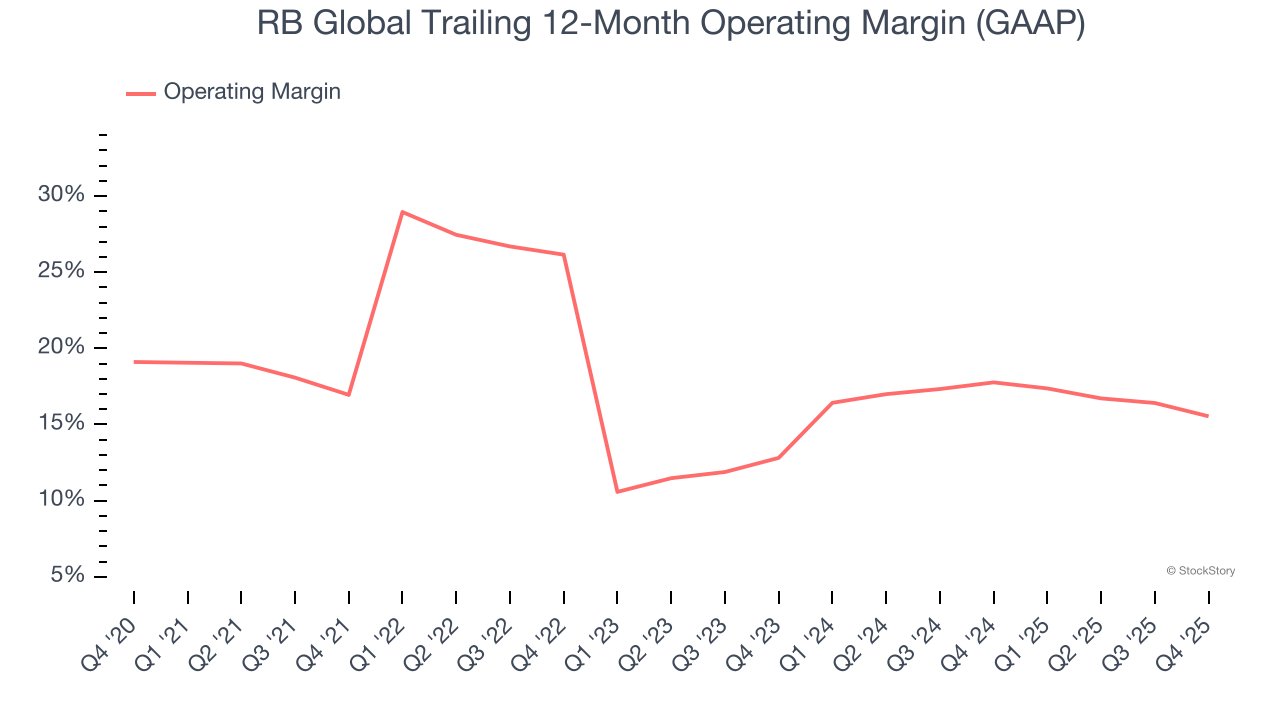
This quarter, RB Global generated an operating margin profit margin of 14.7%, down 3.4 percentage points year on year. This contraction shows it was less efficient because its expenses grew faster than its revenue.
Earnings Per Share
Revenue trends explain a company’s historical growth, but the long-term change in earnings per share (EPS) points to the profitability of that growth – for example, a company could inflate its sales through excessive spending on advertising and promotions.
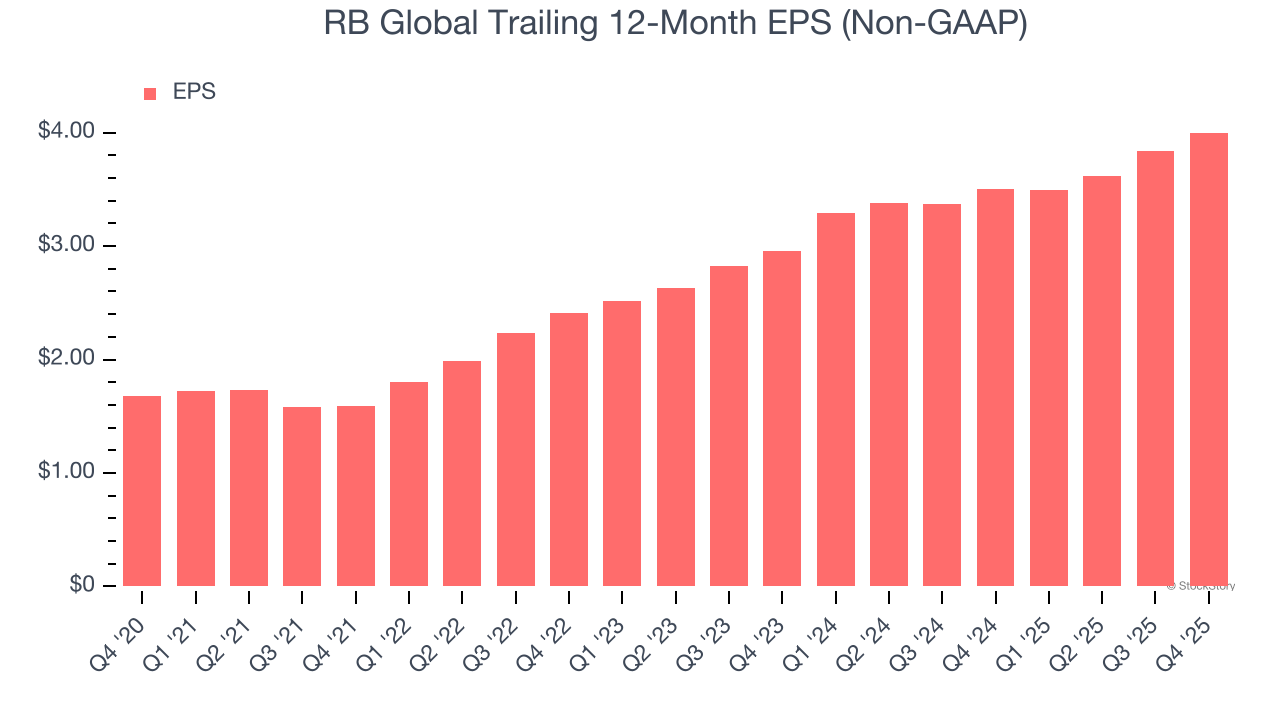
RB Global’s EPS grew at an astounding 18.9% compounded annual growth rate over the last five years. However, this performance was lower than its 27.2% annualized revenue growth, telling us the company became less profitable on a per-share basis as it expanded.
We can take a deeper look into RB Global’s earnings quality to better understand the drivers of its performance. As we mentioned earlier, RB Global’s operating margin declined by 1.4 percentage points over the last five years. Its share count also grew by 68.7%, meaning the company not only became less efficient with its operating expenses but also diluted its shareholders. 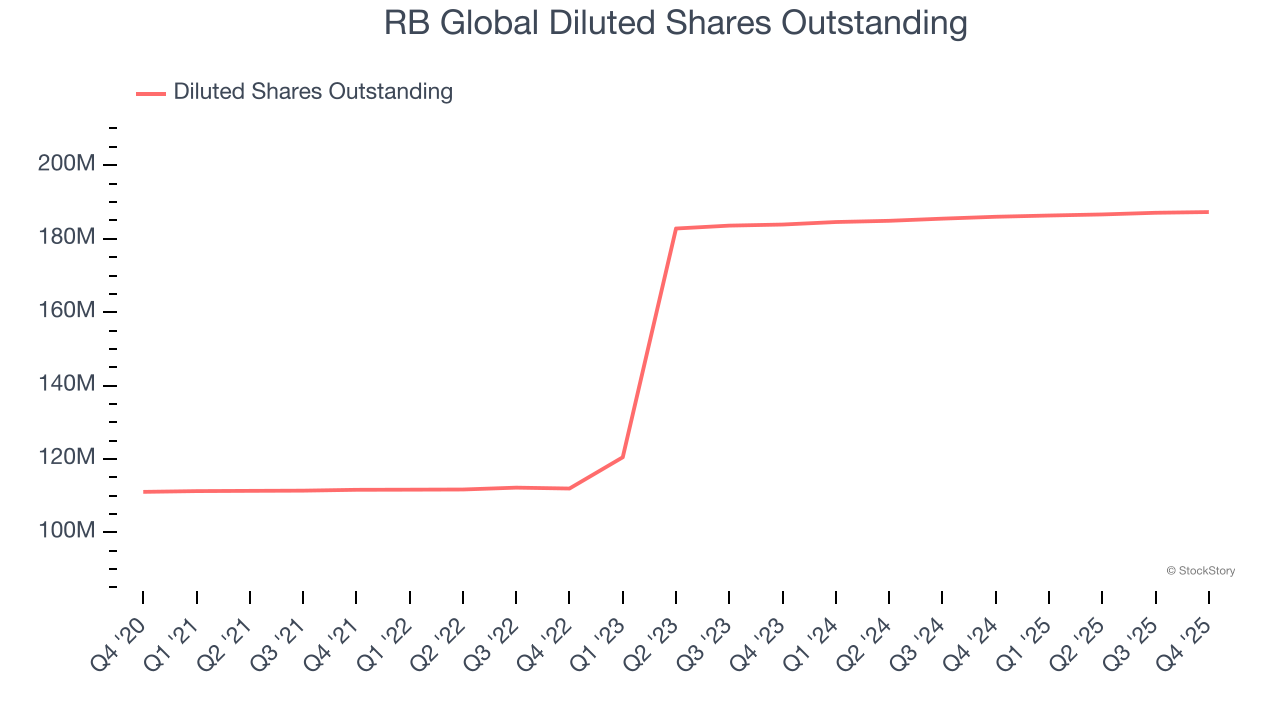
Like with revenue, we analyze EPS over a shorter period to see if we are missing a change in the business.
For RB Global, its two-year annual EPS growth of 16.2% was lower than its five-year trend. We still think its growth was good and hope it can accelerate in the future.
In Q4, RB Global reported adjusted EPS of $1.11, up from $0.95 in the same quarter last year. This print easily cleared analysts’ estimates, and shareholders should be content with the results. Over the next 12 months, Wall Street expects RB Global’s full-year EPS of $4 to grow 8%.
Key Takeaways from RB Global’s Q4 Results
It was good to see RB Global beat analysts’ EPS expectations this quarter. We were also glad its revenue outperformed Wall Street’s estimates. Zooming out, we think this quarter featured some important positives. The stock remained flat at $108.00 immediately after reporting.
Is RB Global an attractive investment opportunity at the current price? If you’re making that decision, you should consider the bigger picture of valuation, business qualities, as well as the latest earnings. We cover that in our actionable full research report which you can read here (it’s free).