Content production and distribution company Sphere Entertainment (NYSE: SPHR) reported calendar Q3 2026 (fiscal Q1 2027) results beating Wall Street’s revenue expectations, with revenue up 4.5% year on year to $274.3 million. Its GAAP loss of $4.84 per share was significantly below analysts’ consensus estimates.
For more on Sphere Entertainment, read our free full research report.
Sphere Entertainment (SPHR) Q3 CY2026 highlights:
- Revenue $274.3 million vs S&P analysts’ consensus estimates of $268.4 million (4.5% year-on-year growth, 2.2% beat)
- EPS (GAAP) -$4.84 vs analysts’ consensus estimates of -$1.67 (significant miss)
- Adjusted operating income $39.15 million vs analysts’ consensus estimates of -$66.47 million (14.3% margin, significant beat)
- Operating margin -87.7%, down from -22.3% in the same quarter last year
- Market capitalization $3.91 billion
Executive Chairman and CEO James L. Dolan said, “With today’s results, our Sphere segment remains on track to deliver substantial growth this calendar year. Looking ahead, we continue to make progress on our long-term vision for Sphere, including a global network of venues and a growing slate of original content.”
Revenue growth
A company’s long-term revenue performance is one signal of its overall quality. Any business can deliver a good quarter or two, but many enduring ones grow for years. Sphere Entertainment’s revenue grew at a weak 7.8% compounded annual growth rate over the last five years, falling short of the consumer discretionary sector benchmark.
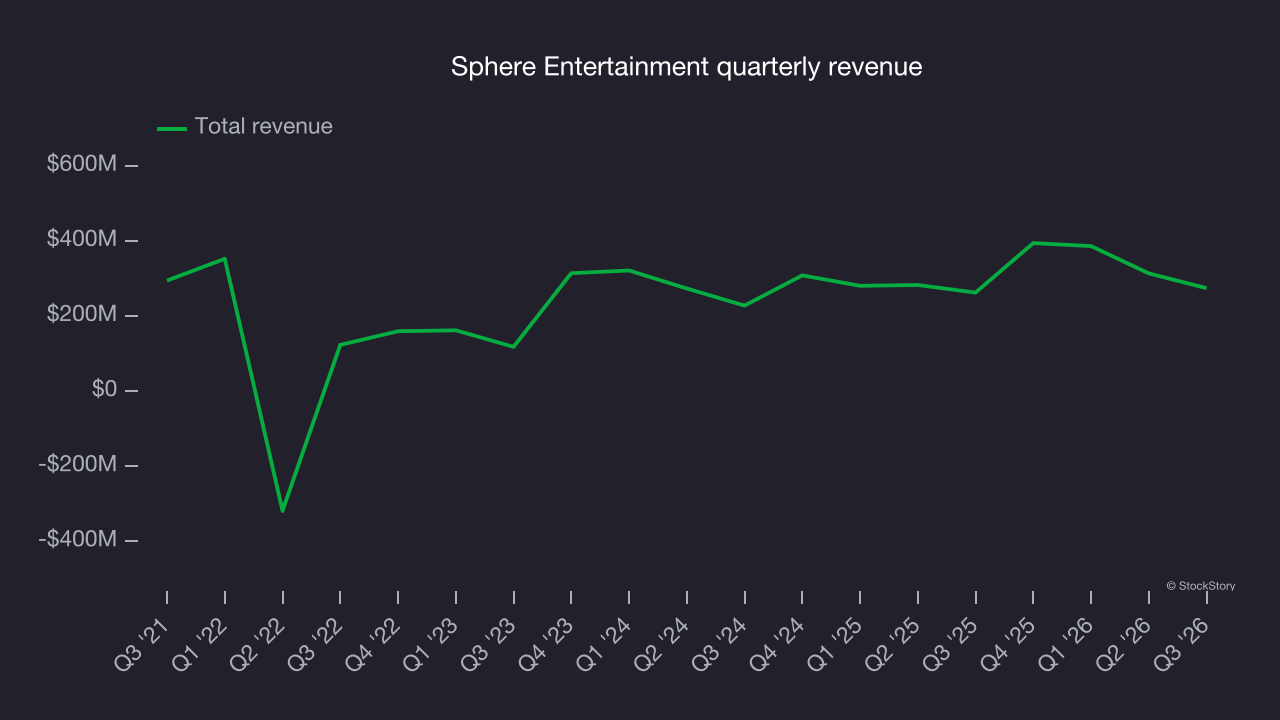
Long-term growth matters most, but within consumer discretionary, a longer historical view may miss a company riding a successful new product or trend. Sphere Entertainment’s annualized revenue growth of 9.7% over the last two years is above its five-year trend, a positive sign. Covid hurt Sphere Entertainment’s business in 2020 and part of 2021, and it rebounded sharply thereafter. 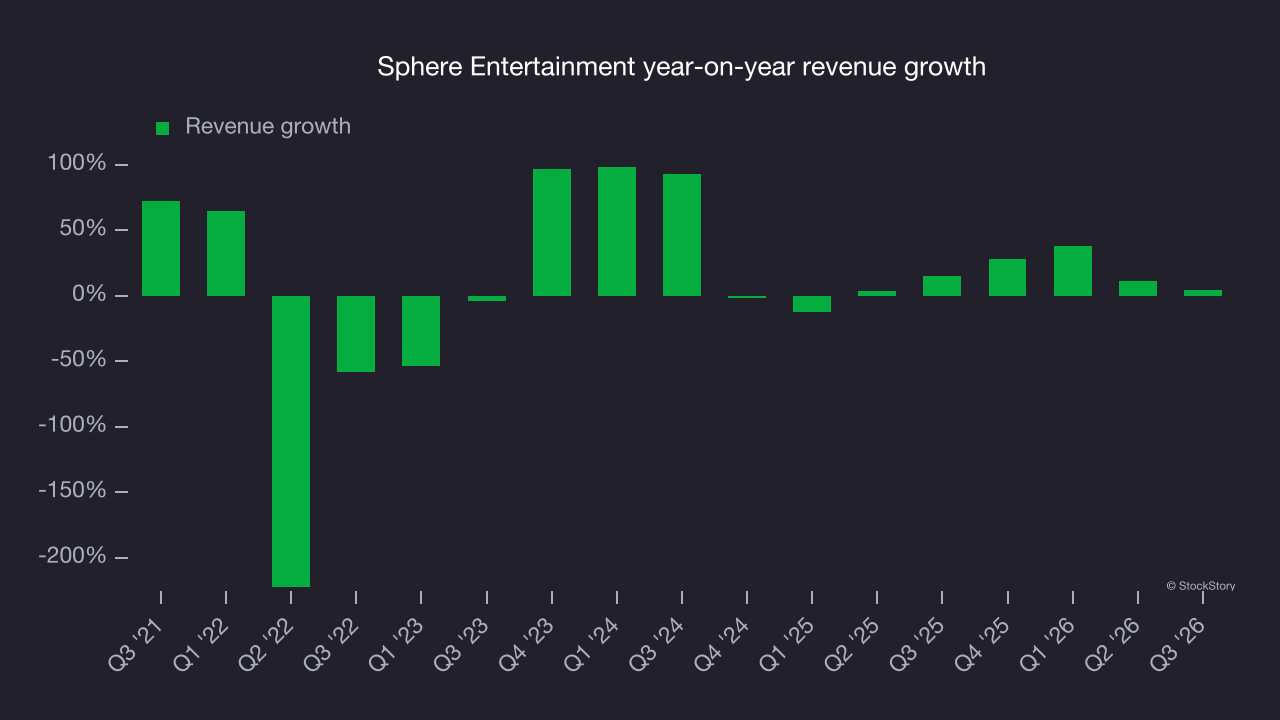
A closer look at the company’s revenue dynamics starts with its most important segments, Sphere and MSG Networks, which account for 72.5% and 27.5% of revenue. Over the last two years, Sphere Entertainment’s Sphere revenue (live events and advertising) averaged 31.4% year-on-year growth. On the other hand, its MSG Networks revenue (content distribution) averaged 13.2% declines. 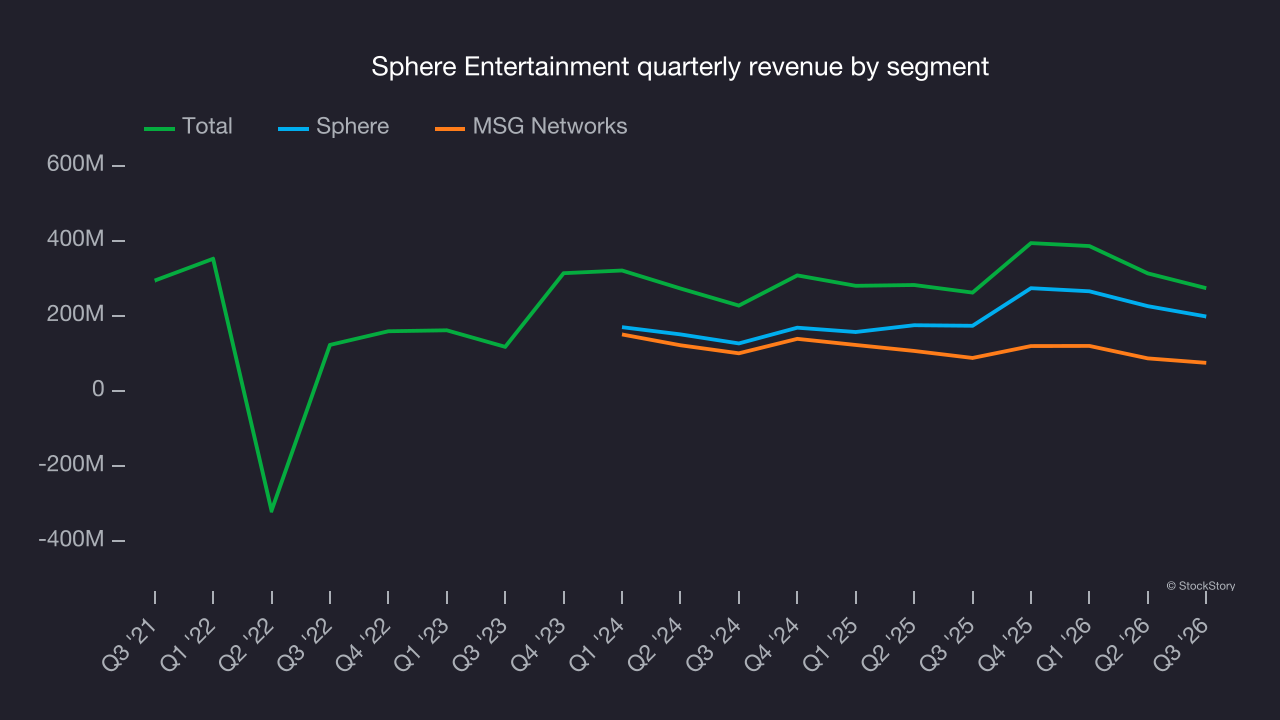
This quarter, Sphere Entertainment reported modest year-on-year revenue growth of 4.5% but beat Wall Street’s consensus estimates by 2.2%.
Looking ahead, sell-side analysts expect revenue to decline by 3.6% over the next 12 months, according to S&P, a deceleration versus the last two years. This underwhelming projection suggests its products and services will face some demand headwinds.
Operating margin
Operating margin is an important measure of profitability as it shows the portion of revenue left after accounting for all core expenses, from the cost of goods sold to advertising and wages. It’s also useful for comparing profitability across companies with different levels of debt and tax rates because it excludes interest and taxes.
Sphere Entertainment’s operating margin has been trending down over the last 12 months and averaged negative 16.2% over the last two years. Unprofitable consumer discretionary companies with falling margins deserve extra scrutiny because they’re spending heavily to stay relevant, an unsustainable practice.
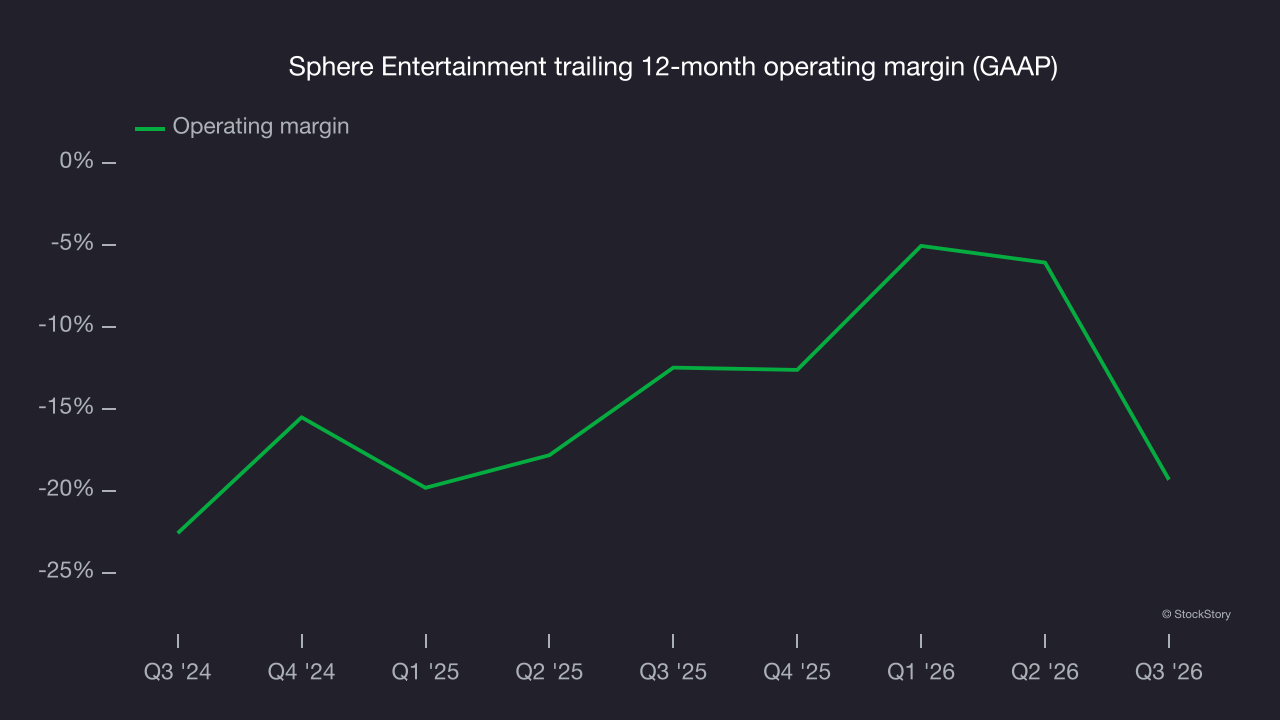
In Q3, Sphere Entertainment generated a negative 87.7% operating margin. The company’s consistent lack of profits raises a flag.
Earnings per share
Revenue trends explain a company’s historical growth, but the long-term change in earnings per share, or EPS, points to the profitability of that growth – for example, a company could inflate its revenue through excessive spending on advertising and promotions.
Although Sphere Entertainment’s full-year earnings are still negative, it reduced its losses and improved its EPS by 21.9% annually over the last five years. The next few quarters will be critical for assessing its long-term profitability.
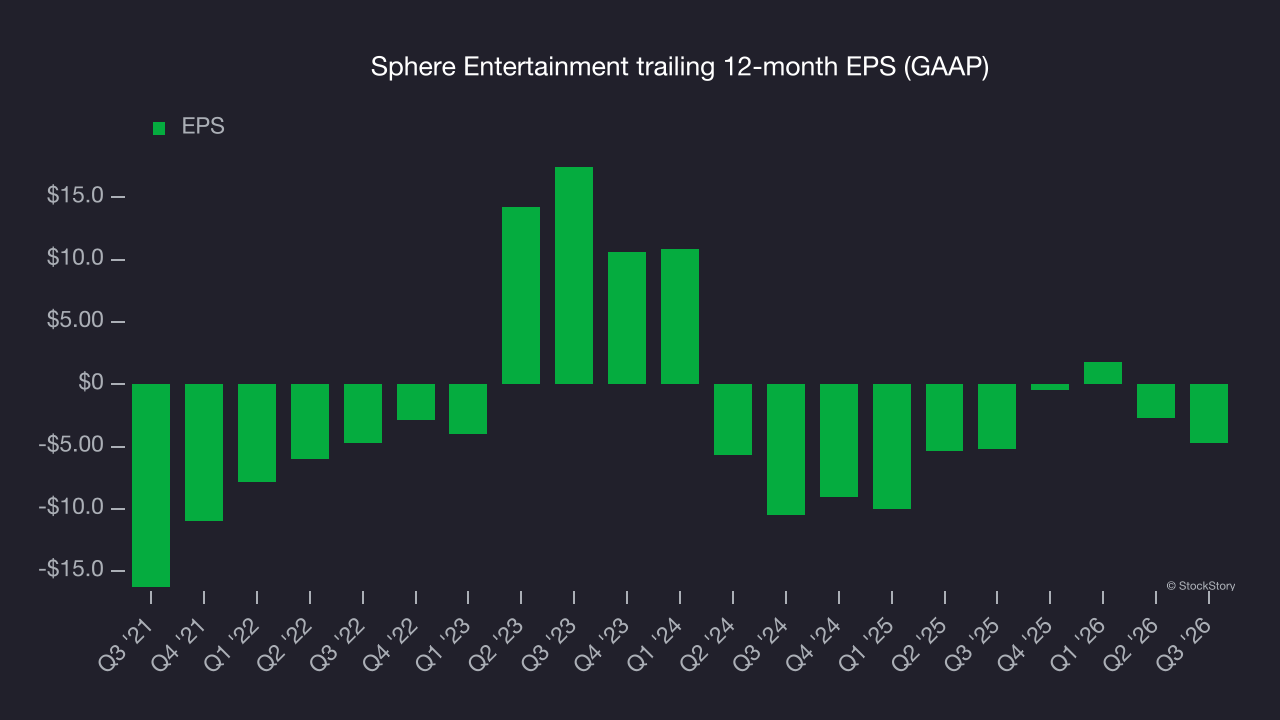
In Q3, Sphere Entertainment reported EPS of negative $4.84, down from negative $2.80 in the same quarter last year. This result missed analysts’ consensus estimates. Over the next 12 months, Wall Street expects Sphere Entertainment to narrow its losses. Analysts forecast its full-year EPS will improve from negative $4.72 to negative $2.85, according to S&P.
Key takeaways from Sphere Entertainment’s Q3 results
Sphere Entertainment topped analysts’ consensus estimates by a wide margin on adjusted operating income, and revenue also beat Wall Street’s consensus. But an EPS miss made Q3 a mixed quarter. The market appeared to be hoping for more, as shares fell 2% to $106.70 immediately after the report.
When evaluating Sphere Entertainment at its current price, consider the bigger picture of valuation, business quality and the latest earnings. For more on these factors, read the full research report here (it’s free).