Self-storage and building solutions company Janus (NYSE: JBI) fell short of the market’s revenue expectations in Q3 2026, with revenue falling 2.8% year on year to $213.1 million. The company’s full-year revenue guidance of $860 million at the midpoint came in 7.6% below analysts’ consensus estimates. Its non-GAAP profit of $0.08 per share was 54.9% below analysts’ consensus estimates.
For more on Janus, read our full research report for free.
Janus (JBI) Q3 2026 highlights:
- Revenue $213.1 million vs S&P analysts' consensus estimates of $235.9 million (2.8% year-on-year decline, 9.7% miss)
- Adjusted EPS $0.08 vs S&P analysts' consensus estimates of $0.18 (54.9% miss)
- Adjusted EBITDA $34 million vs analysts' consensus estimates of $40.77 million (16% margin, 16.6% miss)
- Revenue guidance The company lowered its revenue guidance for the full year to $860 million at the midpoint from $935 million, an 8% decrease
- EBITDA guidance $130 million at the midpoint for the full year, below analysts' consensus estimates of $156.5 million
- Operating margin -2.6%, down from 13.4% in the same quarter last year
- Free cash flow margin 14.8%, up from 3.8% in the same quarter last year
- Market capitalization $649.4 million
Revenue growth
Examining a company’s long-term performance can provide clues about its quality. Any business can report a good quarter or two, but many enduring ones grow for years. Janus’s 6.2% annualized revenue growth over the last five years was solid. Its growth beat the average industrials company and shows its offerings resonate with customers.
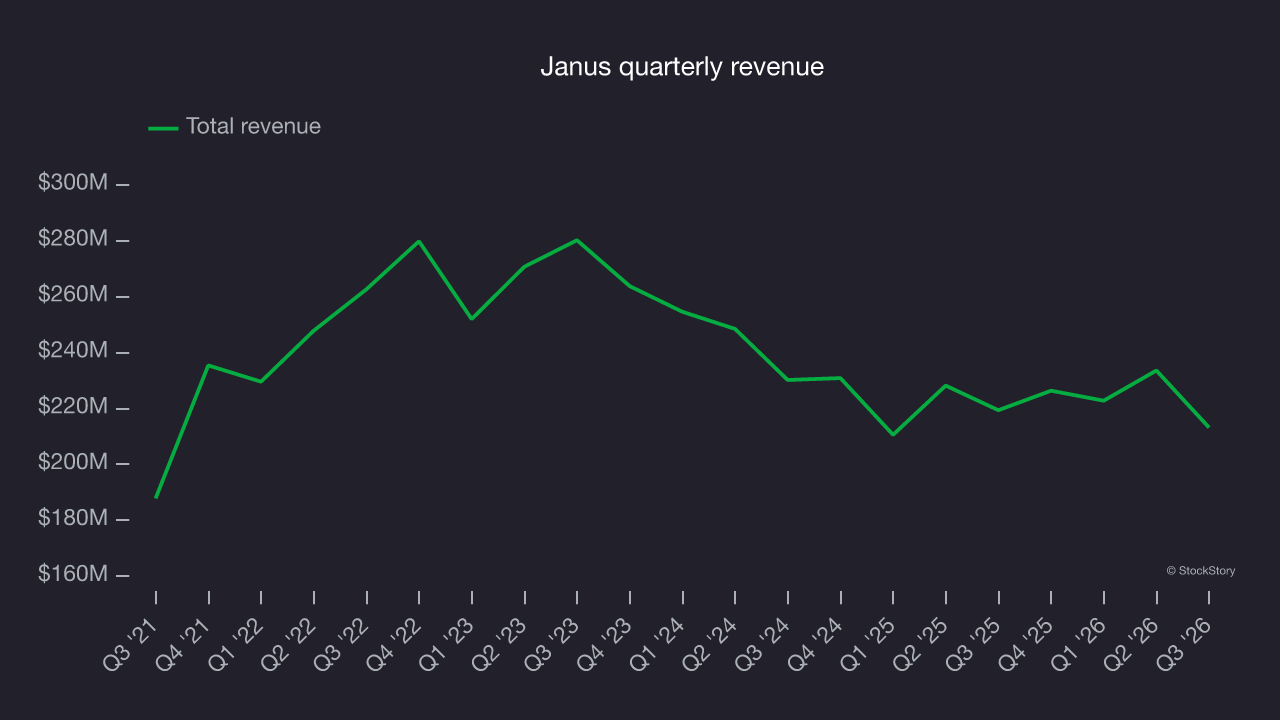
Long-term growth is the most important, but within industrials, a half-decade historical view may miss new industry trends or demand cycles. Janus’s recent performance marks a sharp pivot from its five-year trend as its revenue has shown annualized declines of 5.2% over the last two years. 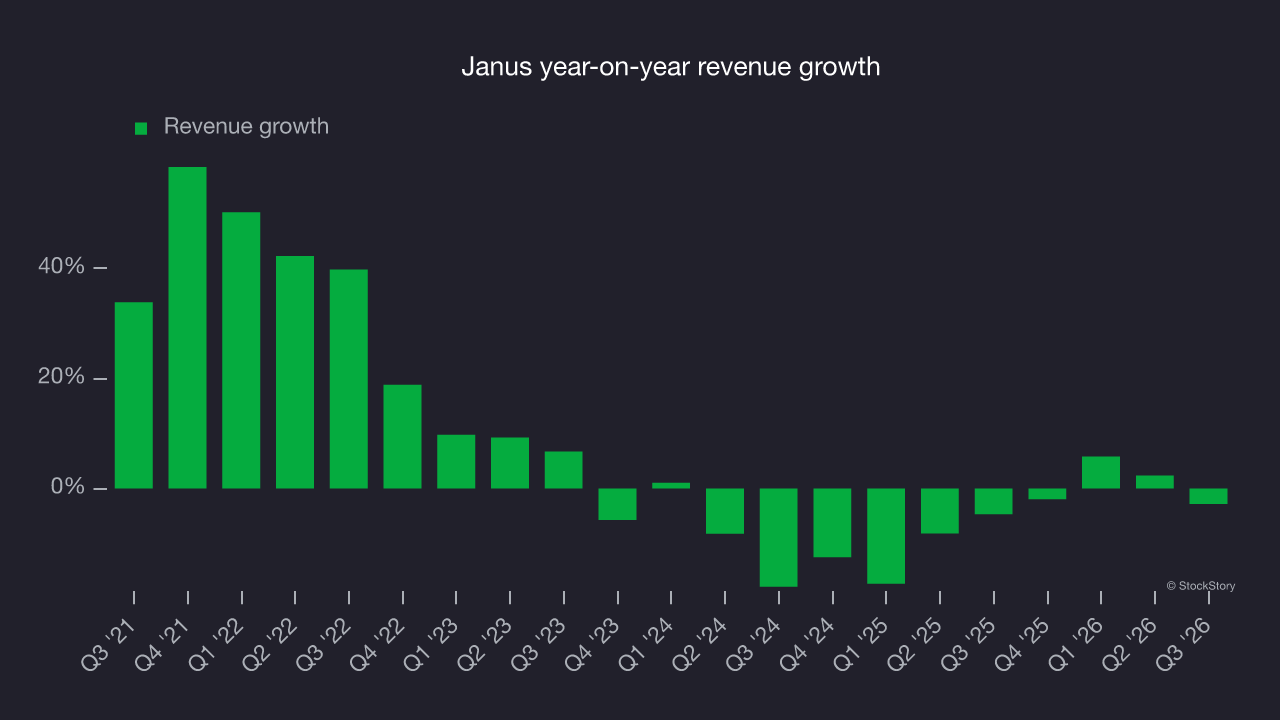
This quarter, Janus missed Wall Street’s consensus estimates and reported an uninspiring 2.8% year-on-year revenue decline, generating $213.1 million in revenue.
Looking ahead, sell-side analysts expect revenue to grow 6.3% over the next 12 months, according to S&P, an improvement versus the last two years. This projection is healthy and indicates its newer products and services will drive better revenue performance.
Operating margin
Operating margin is one of the best measures of profitability because it tells us how much money a company earns after procuring and manufacturing its products, marketing and selling those products and, most importantly, keeping them relevant through research and development.
Over the last five years, Janus’s operating margin fell by 10.7 percentage points. This deterioration shows its costs grew relative to revenue, putting pressure on profitability. Its trailing 12-month operating margin was 5.5%.
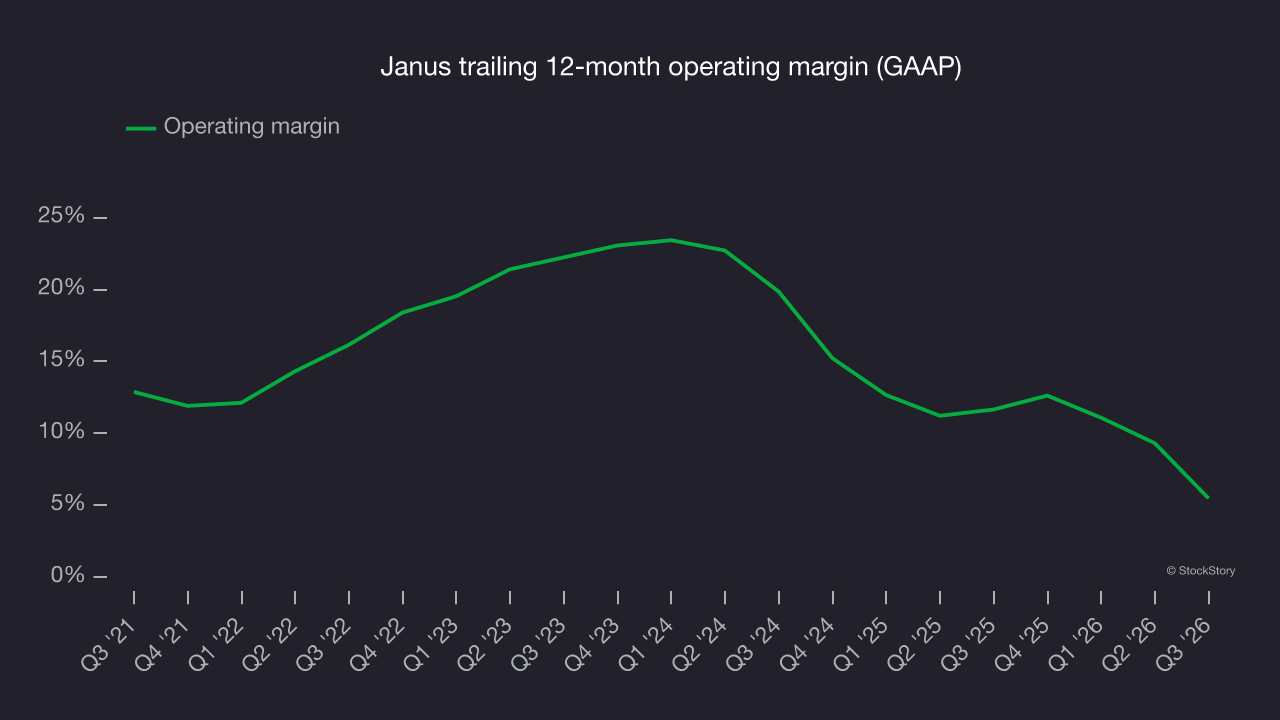
This quarter, Janus generated an operating profit margin of negative 2.6%, down 16 percentage points year on year. Janus’s operating margin decreased more than its gross margin, suggesting it was less efficient because expenses such as marketing, research and development and administrative overhead increased.
Earnings per share
Revenue trends explain a company’s historical growth, but the long-term change in earnings per share (EPS) points to the profitability of that growth. For example, a company could inflate its revenue through excessive spending on advertising and promotions.
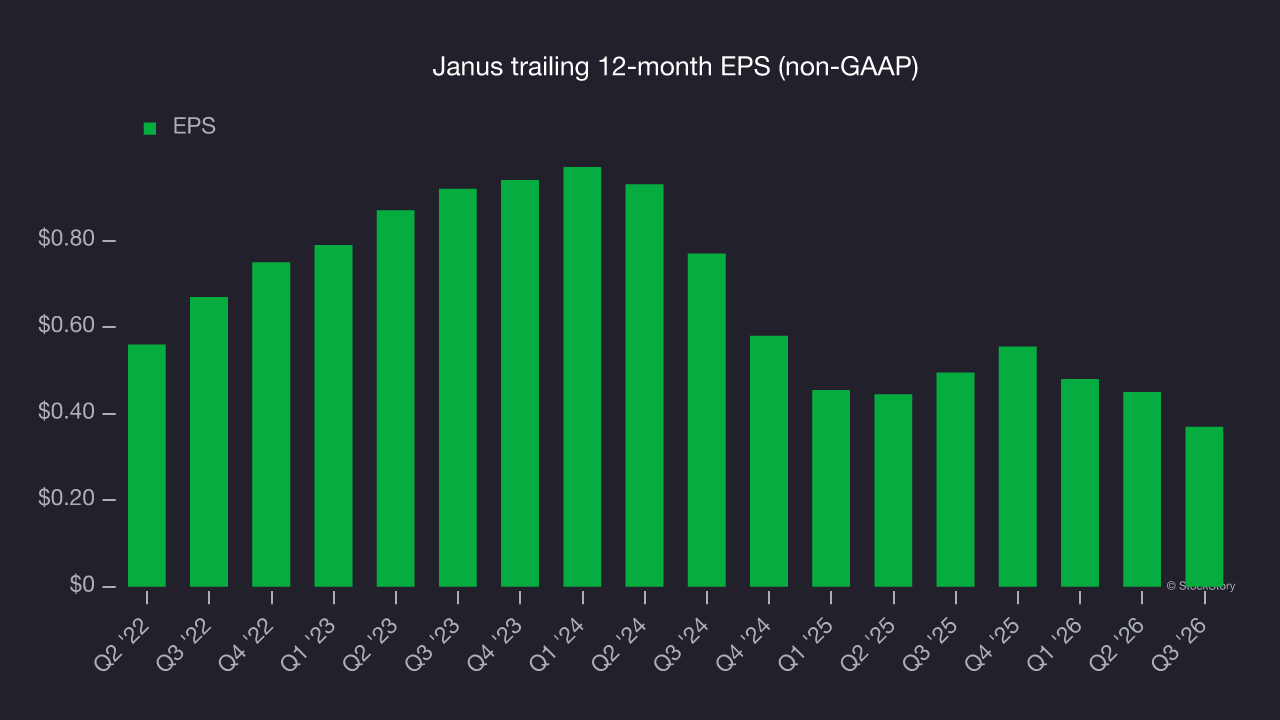
Janus’s full-year EPS dropped 67.7%, or 13.8% annually, over the last four years. Companies with falling revenue and EPS warrant caution, as diminishing earnings could imply changing secular trends and preferences. If conditions turn unexpectedly, Janus’s low margin of safety could leave its stock price susceptible to large declines.
As with revenue, examining EPS over a shorter period can reveal a change in the business.
Janus’s EPS declined by more than its revenue over the last two years, dropping 30.7%. This indicates the company struggled to adjust to shrinking demand.
A closer look at Janus’s earnings helps explain its performance. Janus’s operating margin has declined over the last two years. This was the most relevant factor (aside from the revenue impact) behind its lower earnings; interest expenses and taxes can also affect EPS but reveal less about a company’s fundamentals.
In Q3, Janus reported adjusted EPS of $0.08, down from $0.16 in the same quarter last year. This result missed analysts’ consensus estimates. Over the next 12 months, Wall Street expects Janus’s full-year EPS to grow 79.1% from $0.37 to $0.66, according to S&P.
Key takeaways from Janus’s Q3 results
Janus offered few positives this quarter, with its full-year revenue and EBITDA forecasts both falling short of Wall Street’s consensus estimates. The outlook made for a disappointing report, and shares plunged 28.6% to $3.40 immediately after the release.
Janus’s latest earnings report disappointed. One quarter doesn’t define a company’s quality, so a closer look can help assess whether the stock is worth buying at its current price. The latest quarter matters, but not nearly as much as longer-term fundamentals and valuation when making that decision. For more on Janus, read the full research report here (it’s free).