Credit reporting company TransUnion (NYSE: TRU) met Wall Street’s revenue expectations in Q3 2026, with revenue up 12.2% year on year to $1.31 billion. On the other hand, next quarter’s revenue guidance of $1.28 billion was less impressive, coming in 1.3% below analysts’ consensus estimates. Its non-GAAP profit of $1.25 per share was 3.2% above analysts’ consensus estimates.
For more on TransUnion, read the full research report, available free.
TransUnion (TRU) Q3 2026 highlights:
- Revenue $1.31 billion vs S&P analysts’ consensus estimates of $1.31 billion (12.2% year-on-year growth, in line)
- Adjusted EPS $1.25 vs S&P analysts’ consensus estimates of $1.21 (3.2% beat)
- Adjusted EBITDA $464.8 million vs analysts’ consensus estimates of $462.3 million (35.4% margin, 0.5% beat)
- Revenue guidance $1.28 billion at the midpoint for Q4 2026, below analysts’ consensus estimates of $1.30 billion
- Adjusted EPS guidance Management raised its full-year adjusted EPS guidance to $4.85 at the midpoint, a 1.1% increase
- EBITDA guidance $1.82 billion at the midpoint for the full year, in line with analysts’ consensus estimates
- Operating margin 20.4%, up from 17.8% in the same quarter last year
- Free cash flow margin 27.6%, up from 20.6% in the same quarter last year
- Market capitalization $15.26 billion
“TransUnion delivered another quarter of strong results exceeding our guidance,” said Chris Cartwright, President and CEO. “U.S. Markets revenue grew by 7 percent, led by U.S. Financial Services and Insurance. International accelerated to 10 percent growth on an organic constant currency basis, including 18 percent growth in India.”
Revenue growth
A company’s long-term revenue performance is one signal of its overall quality. Any business can deliver a good quarter or two, but many enduring ones grow for years.
With $5.04 billion in revenue over the past 12 months, TransUnion is one of the larger companies in the business services industry and benefits from a well-known brand that influences purchasing decisions.
TransUnion’s revenue grew at a strong 11.9% compounded annual growth rate over the last five years, showing that its demand was higher than that of many business services companies.
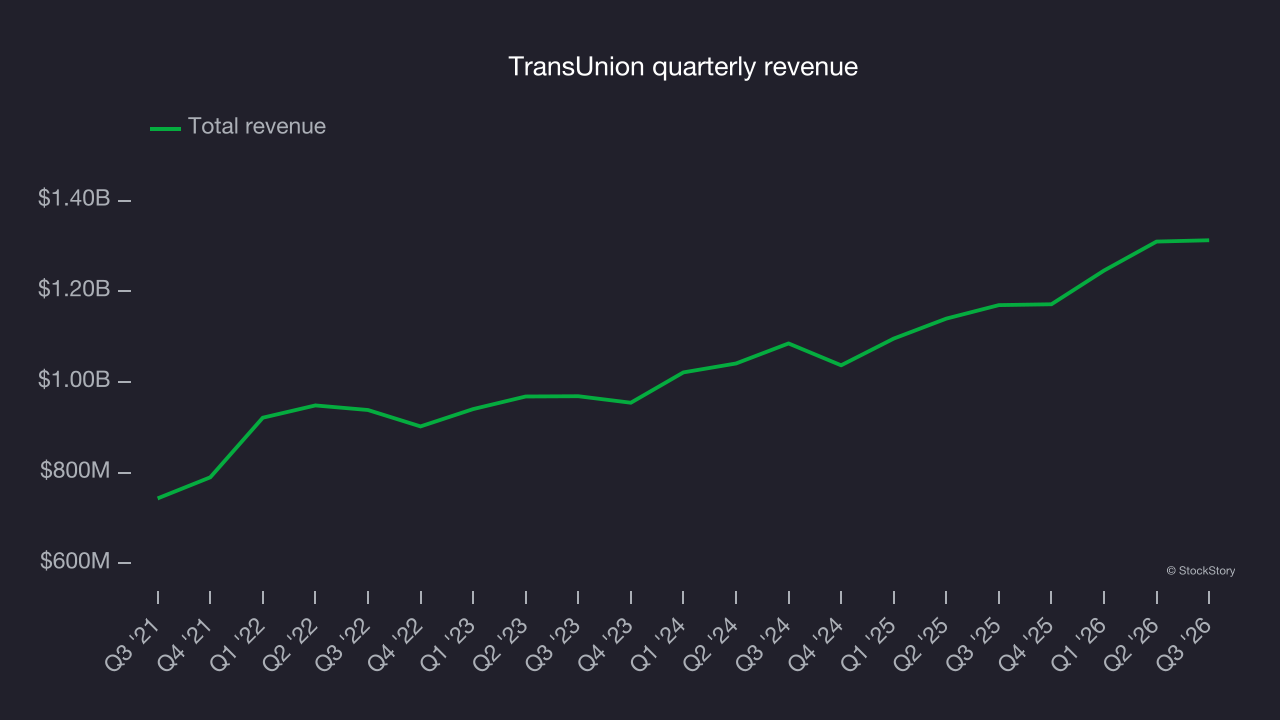
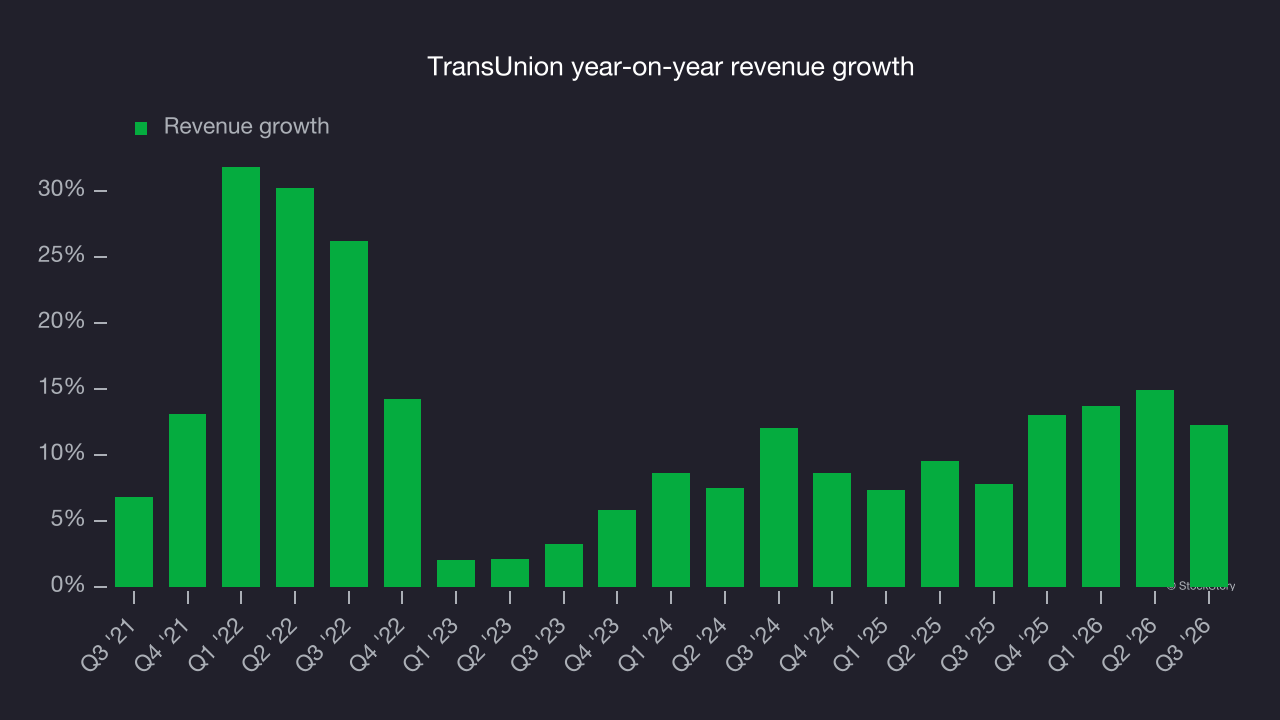
This quarter, TransUnion’s year-on-year revenue growth was 12.2%, and its $1.31 billion of revenue was in line with Wall Street’s consensus estimates. Company management is currently guiding for a 9.2% year-on-year increase in revenue next quarter.
Looking further ahead, sell-side analysts expect revenue to grow 7.8% over the next 12 months, according to S&P, a deceleration versus the last two years. Despite the slowdown, this projection is solid and implies the market is forecasting success for its products and services.
Adjusted operating margin
Adjusted operating margin is a key measure of profitability. Think of it as net income (the bottom line) excluding the impact of non-recurring expenses, taxes and interest on debt – metrics less connected to business fundamentals.
TransUnion has performed well over the last five years. It demonstrated high profitability for a business services company, with an average adjusted operating margin of 29.1%.
Analyzing the trend in its profitability, TransUnion’s adjusted operating margin decreased by 3.1 percentage points over the last five years. This raises questions about the company’s expense base because its revenue growth should have given it leverage on its fixed costs, resulting in better economies of scale and profitability.
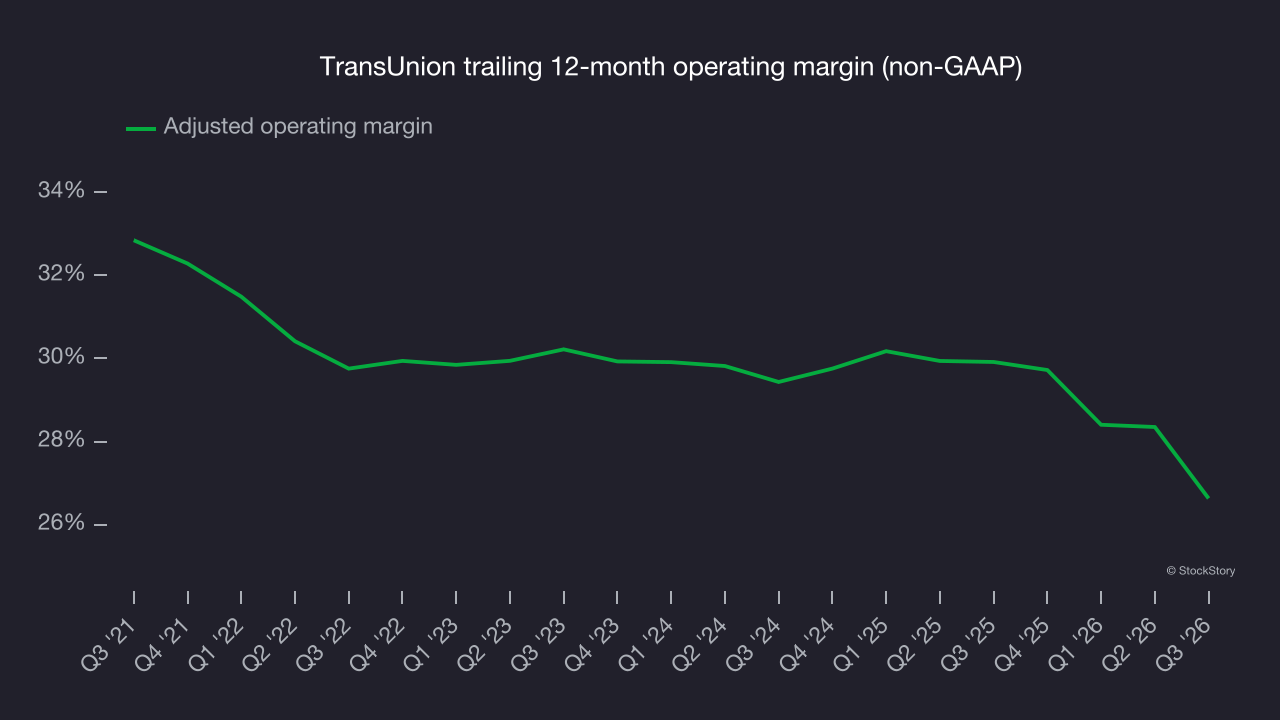
In Q3, TransUnion generated an adjusted operating margin of 23.2%, down 6.8 percentage points year on year. This contraction shows it was less efficient because its expenses grew faster than its revenue.
Earnings per share
Revenue trends explain a company’s historical growth, but the long-term change in earnings per share (EPS) points to the profitability of that growth. For example, a company could inflate its revenue through excessive spending on advertising and promotions.
TransUnion’s EPS grew at an unimpressive 5.1% compounded annual growth rate over the last five years, lower than its 11.9% annualized revenue growth. This tells us the company became less profitable on a per-share basis as it expanded.
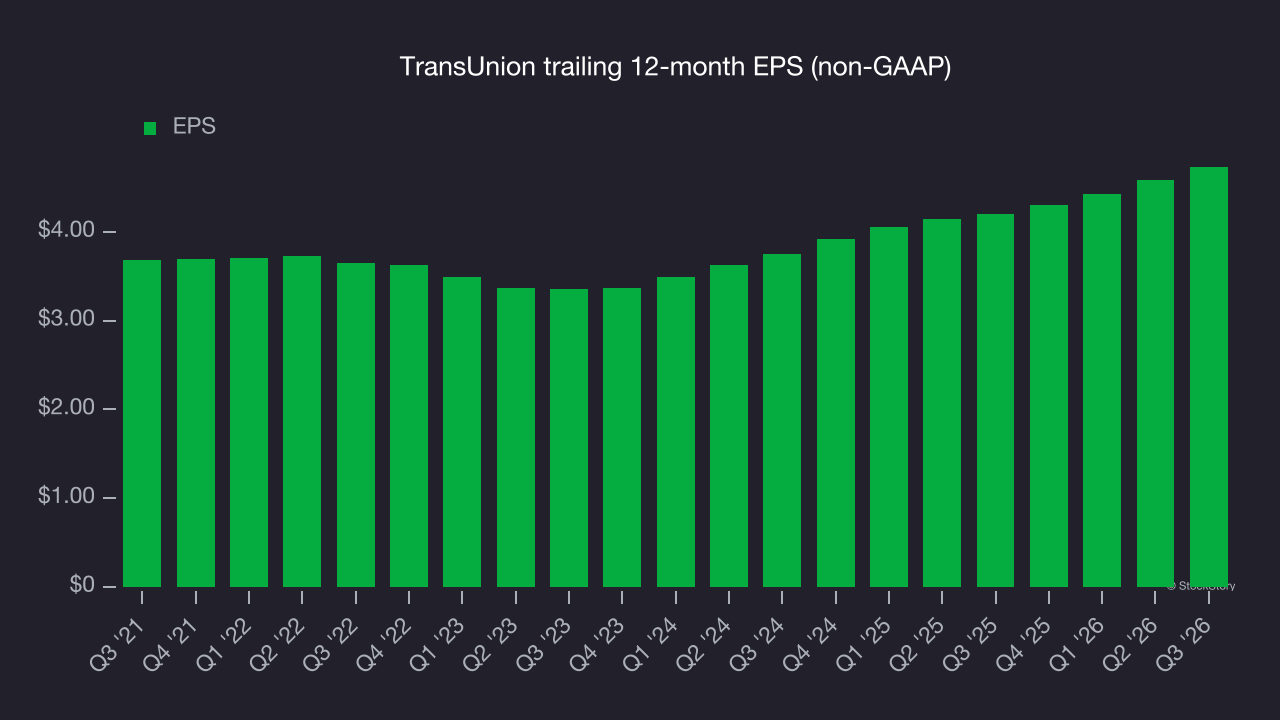
A closer look at TransUnion’s earnings helps explain its performance. TransUnion’s adjusted operating margin declined by 3.1 percentage points over the last five years. This was the most relevant factor (aside from the revenue impact) behind its lower earnings; interest expenses and taxes can also affect EPS but don’t tell us as much about a company’s fundamentals.
As with revenue, examining EPS over a shorter period can reveal changes in the business.
For TransUnion, its two-year annual EPS growth of 12.3% was higher than its five-year trend. This acceleration made it one of the faster-growing business services companies in recent history.
In Q3, TransUnion reported adjusted EPS of $1.25, up from $1.10 in the same quarter last year. This beat analysts’ consensus estimates by 3.2%. Over the next 12 months, Wall Street expects TransUnion’s full-year EPS to grow 10.9% from $4.73 to $5.25, according to S&P.
Key takeaways from TransUnion’s Q3 results
TransUnion’s outlook for next quarter fell short of Wall Street’s consensus estimates for both revenue and EPS. Despite this quarter’s EPS beat and full-year EPS guidance narrowly above consensus, this was a weaker quarter overall. Shares remained flat at $79.80 immediately after the release.
When deciding whether to buy the stock, it’s important to consider its valuation, business qualities and what has happened in the latest quarter. Read the full research report here for more on those factors (it’s free).