Healthcare services company The Ensign Group (NASDAQ: ENSG) fell short of the market’s revenue expectations in Q3 2026, but revenue rose 14.5% year on year to $1.48 billion. On the other hand, the company’s outlook for the full year was close to analysts’ consensus estimates with revenue guided to $5.91 billion at the midpoint. Its GAAP profit of $1.76 per share was 2.7% below analysts’ consensus estimates.
For more on The Ensign Group, read the full research report, available free.
The Ensign Group (ENSG) Q3 2026 highlights:
- Revenue $1.48 billion vs S&P analysts’ consensus estimates of $1.60 billion (14.5% year-on-year growth, 7.1% miss)
- EPS (GAAP) $1.76 vs analysts’ consensus estimates of $1.81 (2.7% miss)
- Adjusted EBITDA $190.7 million vs analysts’ consensus estimates of $186.2 million (12.9% margin, 2.4% beat)
- Revenue guidance The company slightly lifted its revenue guidance for the full year to $5.91 billion at the midpoint from $5.90 billion
- GAAP EPS guidance $7.98 at the midpoint for the full year, beating analysts’ consensus estimates by 12.6%
- Operating margin 9.3%, up from 7.4% in the same quarter last year
- Sales volumes fell 81% year on year (15.1% in the same quarter last year)
- Market capitalization $10.22 billion
“We continue to see strong demand across our portfolio and experienced growth in occupancy and skilled mix during the quarter. In particular, we saw year-over-year growth across all skilled payor categories during the quarter, with growth in Medicare being particularly strong. On the census front, our Same Facilities and Transitioning occupancy for the third quarter was 84.1% and 86.1%, respectively. In addition to growing census, our Same Facilities and Transitioning Facilities skilled mix revenue increased by 10.7% and 10.5%, respectively, over the prior year quarter. Medicare revenue increased for both our Same Facilities and Transitioning Facilities by 11.1% and 7.8%, respectively. Also, managed care revenue increased by 9.1% and 7.2%, respectively, for Same Facilities and Transitioning Facilities over the prior year quarter, with total skilled days up 7.2% and 7.9%, respectively, from the prior year quarter,” Port said.
Revenue growth
Reviewing a company’s long-term revenue performance reveals insights into its quality. Any business can experience short-term success, but top-performing ones sustain growth for years. The Ensign Group’s revenue grew at an impressive 17.2% compounded annual growth rate over the last five years. Its growth beat the average healthcare company and shows its offerings resonate with customers.
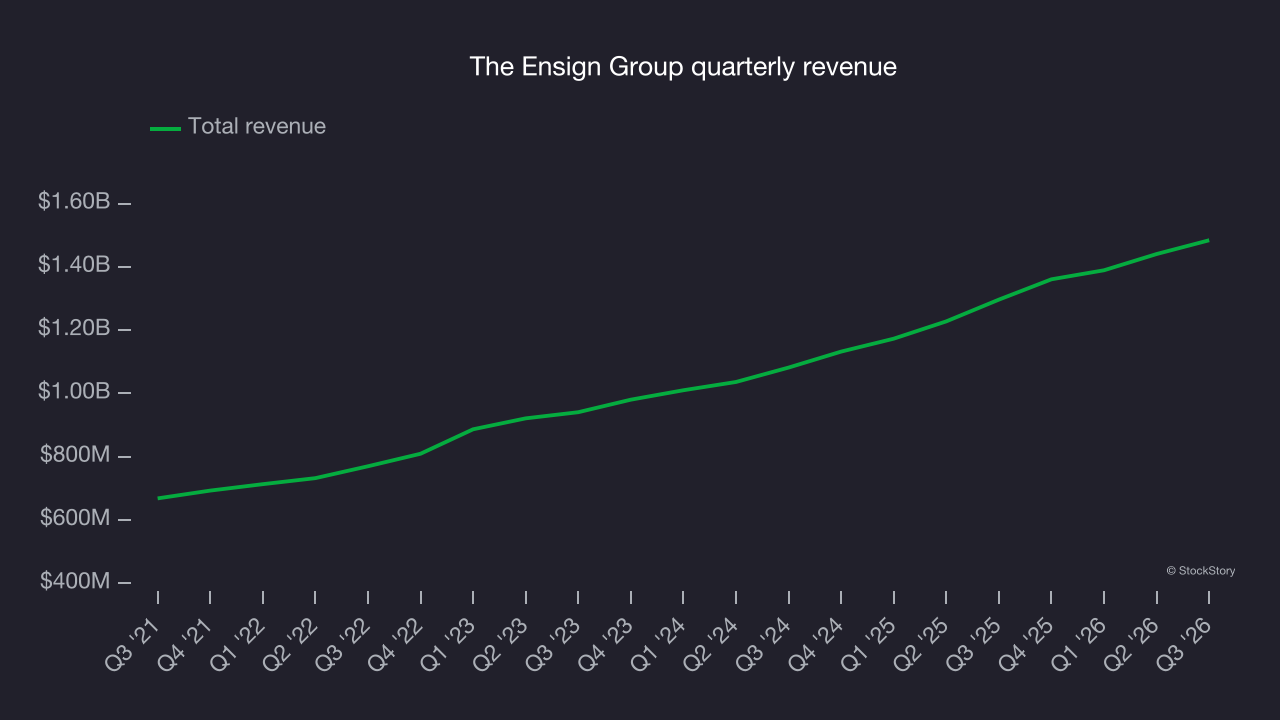
Long-term growth matters the most, but within healthcare, a half-decade historical view may miss recent innovations or disruptive industry trends. The Ensign Group’s annualized revenue growth of 17.5% over the last two years aligns with its five-year trend, suggesting its demand was predictably strong. 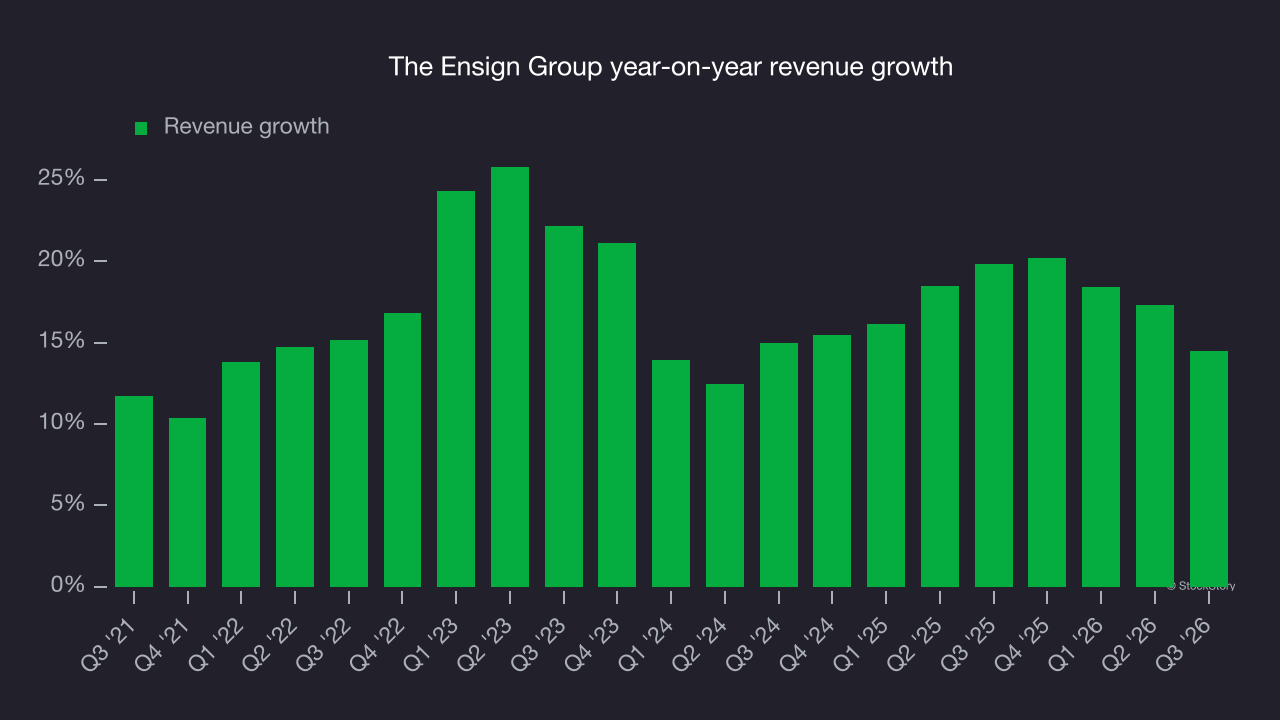
The Ensign Group also reports its number of units sold, which reached 527,965 in the latest quarter. Over the last two years, The Ensign Group’s units sold averaged 26.3% year-on-year declines. Revenue growth outpaced this metric, indicating that the company benefited from price increases. 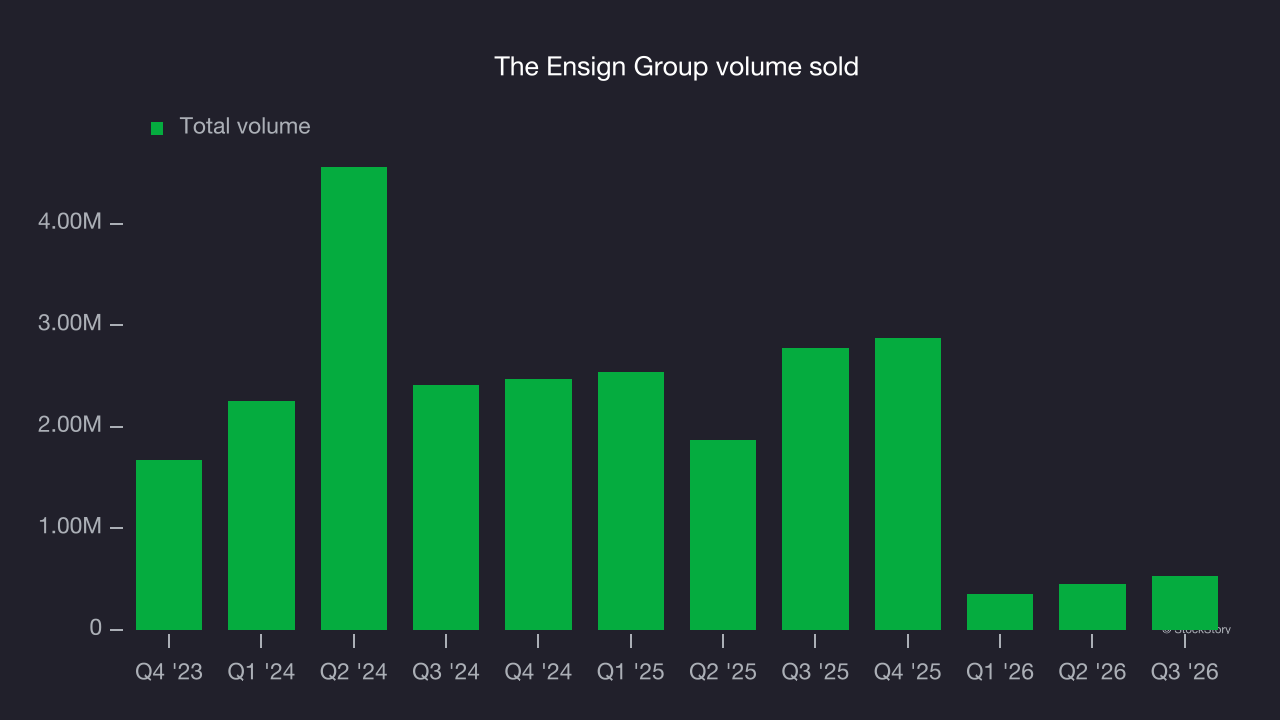
This quarter, The Ensign Group’s revenue grew by 14.5% year on year to $1.48 billion but fell short of Wall Street’s consensus estimates.
Looking ahead, sell-side analysts expect revenue to grow 19.7% over the next 12 months, according to S&P, an improvement versus the last two years. This projection is noteworthy and suggests its newer products and services will spur better top-line performance.
Adjusted operating margin
The Ensign Group’s adjusted operating margin has generally stayed the same over the last 12 months, averaging 10% over the last five years. This profitability was mediocre for a healthcare business and caused by its suboptimal cost structure.
The Ensign Group’s adjusted operating margin may have fluctuated slightly, but it has generally stayed the same over the last five years. This raises questions about the company’s expense base because its revenue growth should have given it leverage on its fixed costs, resulting in better economies of scale and profitability.
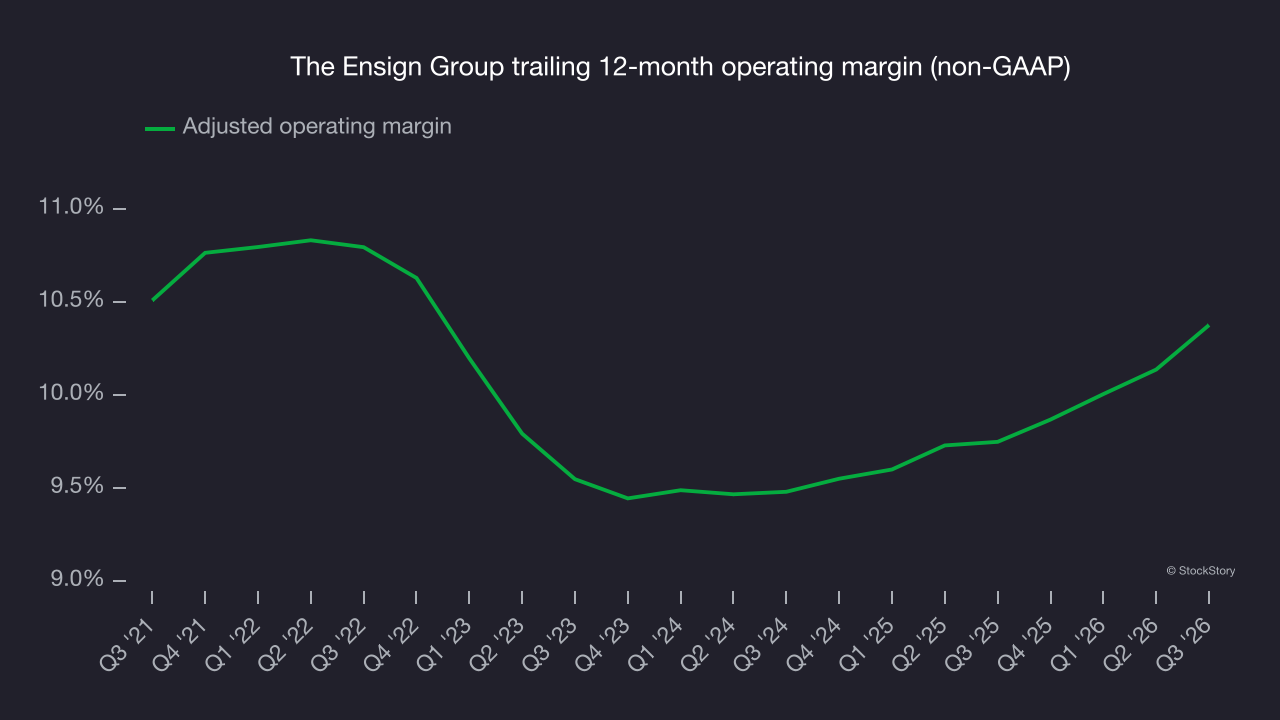
This quarter, The Ensign Group generated an adjusted operating margin of 10.6%, in line with the same quarter last year. This indicates the company’s overall cost structure has been relatively stable.
Earnings per share
Long-term earnings per share (EPS) growth matters for the same reason as long-term revenue growth. Compared to revenue, however, EPS highlights whether a company’s growth is profitable.
The Ensign Group’s EPS grew at a strong 14.7% compounded annual growth rate over the last five years. However, this performance trailed its 17.2% annualized revenue growth, indicating that the company became less profitable on a per-share basis as it expanded.
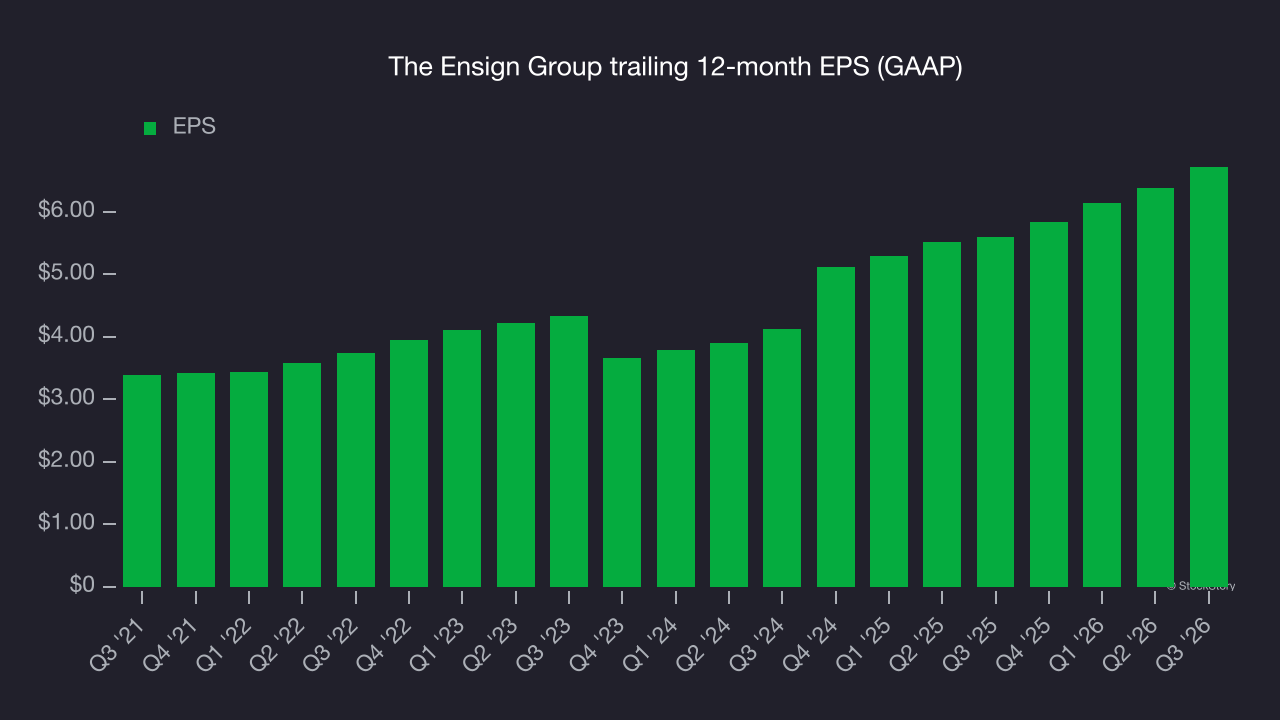
A closer look at The Ensign Group’s earnings helps explain the drivers of its performance. A five-year view shows The Ensign Group has diluted its shareholders, growing its share count by 4.1%. This has led to lower per share earnings. Taxes and interest expenses can also affect EPS but don’t tell us as much about a company’s fundamentals. 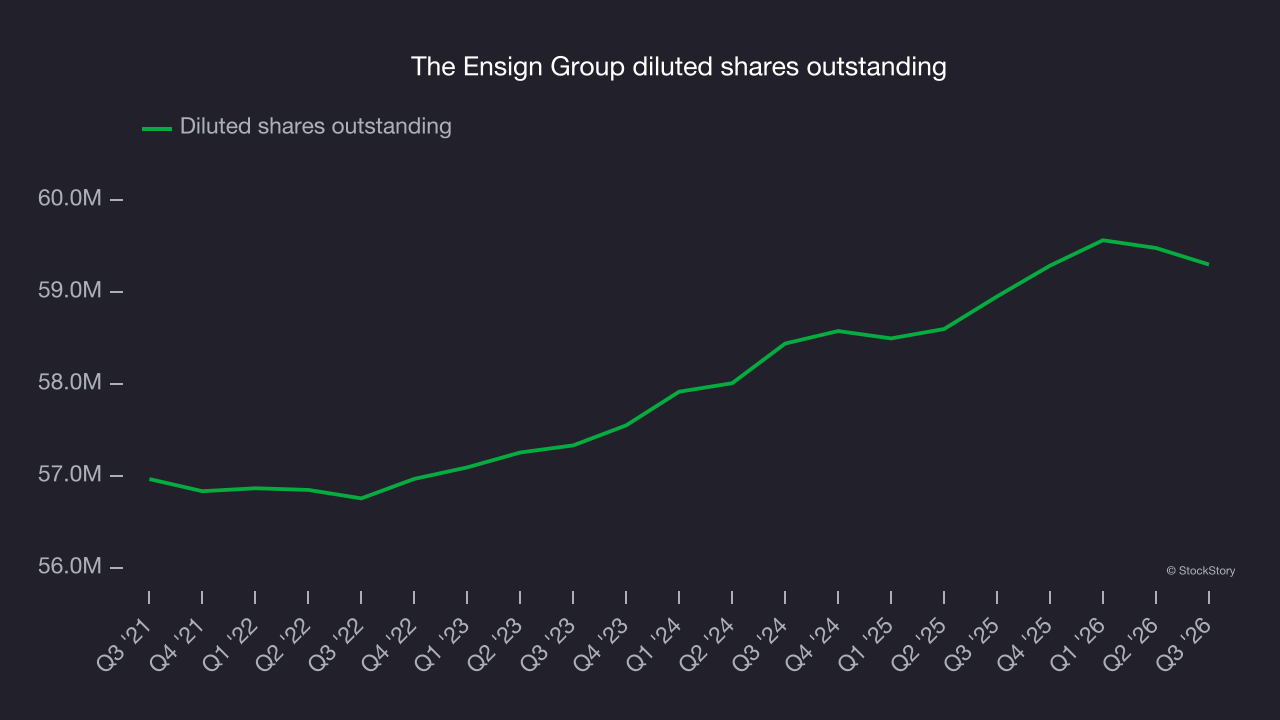
In Q3, The Ensign Group reported EPS of $1.76, up from $1.42 in the same quarter last year. Despite growing year on year, this result missed analysts’ consensus estimates, but long-term EPS growth matters more than short-term movements. Over the next 12 months, Wall Street expects The Ensign Group’s full-year EPS to grow 14.2% from $6.72 to $7.67, according to S&P.
Key takeaways from The Ensign Group’s Q3 results
The Ensign Group delivered a softer quarter, with revenue and EPS falling short of Wall Street’s consensus estimates. The brighter spot was its full-year EPS guidance, which came in well above analysts’ consensus estimates. Shares remained flat at $169.49 immediately after the release.
The Ensign Group’s latest quarter is only one part of its longer-term business quality picture. Quality, when combined with valuation, can help determine if the stock is a buy. Read the full research report here (it’s free).