News Source: Optimal Blue
More than four out of five mortgage locks were tied to purchase transactions in May, but conversion rates declined across both purchase and refinance pipelines
PLANO, Texas, June 9, 2026 (SEND2PRESS NEWSWIRE) — Optimal Blue today released its May 2026 Market Advantage mortgage data report, which found that mortgage activity continued to cool as higher rates weighed on both purchase and refinance demand. Total rate-lock volume declined 9% month over month (MoM) but remained 7% higher year over year (YoY). Purchase activity continued to dominate production, accounting for just over 81% of total lock volume, while refinance share fell to 19%, its lowest level since June 2025.
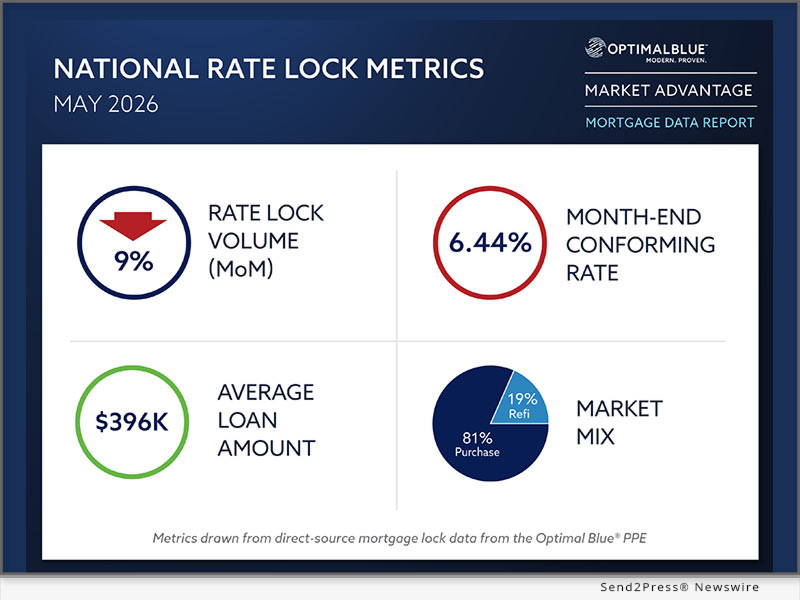
Image caption: Optimal Blue’s May 2026 Market Advantage mortgage data report.
Mortgage rates moved higher in May, with the Optimal Blue Mortgage Market Indices (OBMMI) 30-year conforming fixed rate increasing 13 basis points (bps) month over month to 6.44%. The 10-year Treasury yield rose 5 bps to 4.45%, while the spread between the 10-year Treasury and the 30-year mortgage rate widened to just under 200 bps.
“Purchase activity continues to be the loan purpose leader in spite of affordability pressures,” said Mike Vough, senior vice president of corporate strategy at Optimal Blue. “More than four out of five mortgage locks were tied to purchase transactions in May, but the more notable shift may be what happened after borrowers locked. Pull-through rates declined across both purchase and refinance pipelines, which tells us borrowers are closely monitoring changes in the rate market.”
Secondary market activity reflected shifting execution preferences in May. Agency mortgage-backed securities (MBS) executions declined to 41% of funded loan sales, while cash executions increased to 32%. Mortgage servicing rights (MSRs) for conforming 30-year loans increased 7 bps to 1.36%, representing a 5.44 multiple.
“We saw lenders continue to balance different execution options during May,” Vough said. “Agency MBS share declined while cash executions gained ground, reflecting the impact of agency execution strategies and/or specified pay-up impacts.”
Key findings from the Market Advantage report, derived from direct-source mortgage lock and secondary market data, include:
Volume trends and market composition
- Refi demand retreats: Refinance share declined to 19% of total lock volume in May, its lowest level since June 2025. Rate-and-term refinance volume fell 34% MoM but remained 46% higher YoY, while cash-out refinance volume declined 13% MoM but remained 7% higher YoY.
- Purchase share exceeds 80%: Purchase loans accounted for over 81% of total lock volume in May. Purchase lock volume declined 5% MoM but remained 3% higher YoY.
- Conforming share continues decline: Conforming share declined to just under 49% of total lock volume in May after falling below 50% for the first time in April. FHA share increased to 19%, non-conforming rose to 19%, VA declined to 13% and USDA held at 1%.
- Non-QM share expands: Non-qualified mortgage loans accounted for 9% of total lock volume in May, up 83 bps MoM and 207 bps YoY.
- Borrowers continue turning to ARMs: Adjustable-rate mortgages accounted for 11% of total production in May, the highest level since October 2022 outside of March 2026.
- Property mix favors single-family homes: Single-family homes represented 64% of production in May, while planned unit developments (PUDs), a proxy for new construction activity, accounted for 28% of volume. Condo share declined to 6%.
Rates and pricing
- Mortgage-to-Treasury spread widens: The OBMMI 30-year conforming fixed rate increased 13 bps MoM to 6.44%. Jumbo rates rose 27 bps to 6.70%, FHA rates increased 21 bps to 6.27% and VA rates climbed 15 bps to 6.06%. The 10-year Treasury yield increased 5 bps to 4.45%, while the mortgage-to-Treasury spread widened to just under 200 bps.
- Servicing values gain ground: MSRs for conforming 30-year loans increased 7 bps to 1.36%, representing a 5.44 multiple moving in line with OBMMI.
- Execution spreads diverge: Best-efforts-to-mandatory spreads held at 39 bps for conventional 30-year products and increased 4 bps to 47 bps for conventional 15-year products. Government 30-year spreads decreased 1 bp to 11 bps.
- Top-tier pricing share declines: The share of loans sold at the highest price tier declined 208 bps to 77%, while fourth-tier-or-lower executions increased 86 bps to 6%. Third-tier share declined 18 bps to 4%.
Channel and execution
- Agency MBS executions retreat: Hedged loan sales to agency MBS declined 349 bps to 41% of funded loan sales.
- Cash executions gain share: Cash executions increased 362 bps to 32% of funded loan sales.
- Investor count returns to 14: Investor participation declined to 14 in May after reaching 15 in April.
Product mix and borrower profiles
- First-time buyer participation softens: First-time homebuyers accounted for 44% of conforming purchase locks, 70% of FHA purchase locks and 44% of VA purchase locks, reflecting modest declines across all three major product categories.
- DTI ratios show little change: Purchase debt-to-income ratios remained relatively stable, with conforming at 36.4%, FHA at 43.6% and VA at 42.8%.
- Credit profiles remain stable: The average purchase credit score held at 731. Conforming borrowers averaged 754, FHA borrowers averaged 677 and VA borrowers averaged 715.
- Pipeline conversion weakens: Purchase pull-through fell 539 bps MoM to 76.7% and declined 636 bps YoY. Refinance pull-through dropped 1,332 bps MoM to 65.3% but remained 304 bps higher YoY.
- Loan balances edge higher: The average locked loan amount increased to $395,536 from $394,046 in April, while average loan-to-value (LTV) was 81.6%. Average loan amounts ranged from $917,568 in greater San Francisco to $307,833 in Cincinnati, while regional LTVs ranged from 68.7% in greater San Francisco to 89.1% in San Antonio.
To view the full May 2026 Market Advantage report, complete the free subscription form: https://engage.optimalblue.com/market-advantage.
Subscribers receive a report PDF each month with the latest data. Members of the press are eligible for special, advance access each month and should contact Alexandra Kreuter to be added to the media list.
About the Market Advantage Report
Optimal Blue issues the Market Advantage mortgage report each month to provide insight into U.S. mortgage trends and drivers of lending profitability. Data is sourced from the Optimal Blue PPE, which is used to price and lock more than one-third of all mortgages nationwide, and Optimal Blue’s hedging and loan trading system, which supports approximately 40% of loans hedged and sold into the secondary market. As the leader in mortgage capital markets technology, Optimal Blue has a direct view of both origination and secondary market activity and the interconnectedness of the two. Unlike self-reported survey data, Optimal Blue’s direct-source data accurately reflect the in-process loans in lenders’ pipelines and secondary market executions. Visit Optimal Blue’s website to subscribe to receive the free report each month.
Nothing herein shall be construed as, nor is Optimal Blue providing, any legal, trading, hedging or financial advice.
About Optimal Blue
Optimal Blue powers profitability across the mortgage capital markets ecosystem. As the industry’s only end-to-end capital markets platform, our technology, data and integrations bridge the primary and secondary markets to help lenders of all sizes maximize performance – from pricing accuracy to margin protection and every step in between. Backed by over 20 years of proven expertise, our modern, cloud-native technology delivers the real-time automation, actionable data and seamless connectivity lenders need to navigate market volatility and scale for growth. To learn more about how Optimal Blue delivers measurable ROI, visit OptimalBlue.com.
MULTIMEDIA
Image link for media: https://www.Send2Press.com/300dpi/26-0609-s2p-opblue-rep-300dpi.webp
Image caption: Optimal Blue’s May 2026 Market Advantage mortgage data report.
This press release was issued on behalf of the news source (Optimal Blue), who is solely responsible for its accuracy, by Send2Press Newswire.
To view the original story, visit: https://www.send2press.com/wire/optimal-blue-report-purchase-market-remains-resilient-as-pull-through-rates-weaken/
Copr. © 2026 Send2Press® Newswire, Calif., USA. -- REF: S2P STORY ID: S2P136037 FCN26-4A
INFORMATION BELOW THIS PAGE, IF ANY, IS UNRELATED TO THIS PRESS RELEASE.


