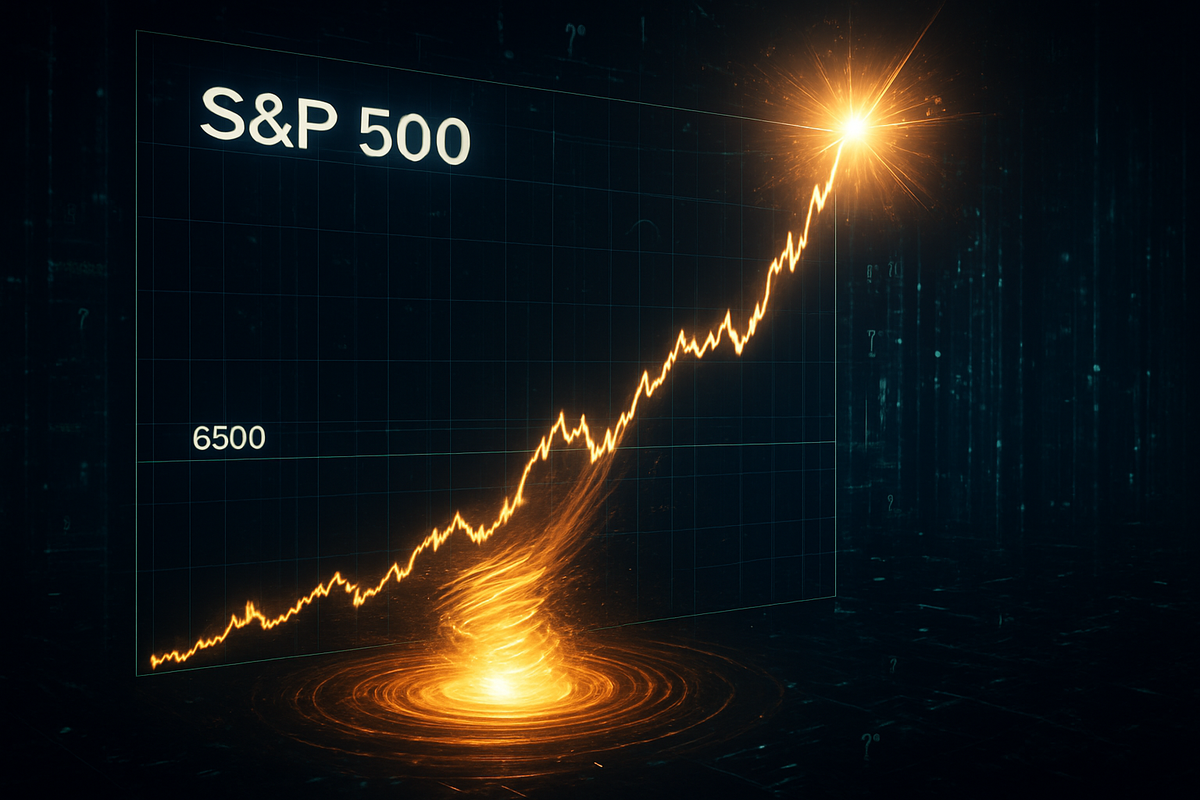
In a stunning display of market mechanics over-powering fundamental sentiment, the S&P 500 decisively shattered the 6,500 resistance level on April 1, 2026, fueled by a massive "Short Gamma" squeeze. The move, which saw the index surge over 100 points in a matter of hours, was orchestrated not by a wave of new retail enthusiasm, but by the mechanical necessity of market makers forced to hedge a staggering -$7.5 billion in net gamma exposure.
As the index breached the critical 6,500 threshold, it triggered a self-reinforcing feedback loop. Market makers, who had sold a vast amount of call options to investors throughout a volatile first quarter, found themselves in a "negative gamma" trap. To remain delta-neutral, these dealers were forced to buy S&P 500 futures and underlying equities at an accelerating pace as prices rose, effectively providing the fuel for the very rally they were trying to hedge against.
The Anatomy of the April 1 Breakout
The seeds of the April 1 squeeze were sown in the closing weeks of March 2026. Following a "growth scare" that saw the S&P 500 decline 7.1% year-to-date, institutional investors began hedging heavily, while others bet on a sharp Q2 recovery using out-of-the-money call options. By the time the opening bell rang on April 1, market makers held an estimated -$7.5 billion in net gamma exposure. This meant that for every 1% move in the index, dealers were required to buy or sell billions of dollars worth of the underlying asset to manage their risk.
The catalyst arrived in the form of geopolitical de-escalation rumors regarding a conditional ceasefire in the U.S.-Iran conflict, paired with a surge in AI-sector optimism. As the S&P 500 approached 6,500, it hit what traders call an "acceleration zone." Market makers, led by major desks at firms like Goldman Sachs (NYSE: GS) and Morgan Stanley (NYSE: MS), had to buy into the rising market to cover their rapidly expanding "delta" risk. This forced buying occurred in a liquidity vacuum, as many sellers had already retreated, sending the index to a midday high of 6,605.62.
Key to this movement was the expiration and reset of the massive quarterly "put-spread collar" managed by JPMorgan Chase & Co. (NYSE: JPM). The collar had a significant strike level at 6,475, which had acted as a "gamma wall" or a ceiling for the market throughout late March. Once the index cleared 6,475 and then 6,500, the wall crumbled, and the dealer hedging requirements shifted from a headwind to a massive tailwind, effectively "squeezing" the market higher.
Winners and Losers in the Gamma Trap
The primary beneficiaries of this mechanical rally were the large-cap technology stocks that dominate the S&P 500 index. As market makers rushed to hedge their index-level exposure, they were forced to buy the heaviest-weighted components of the index. Nvidia (NASDAQ: NVDA) and Microsoft (NASDAQ: MSFT) saw significant intraday gains of 4.2% and 3.1% respectively, as they became the primary vehicles for dealer hedging. Furthermore, specialized market-making firms like Virtu Financial (NASDAQ: VIRT) benefited from the surge in volume and volatility, as the rapid price action increased the spread-capture opportunities for high-frequency trading desks.
On the losing side of the trade were short-biased hedge funds and retail investors holding inverse exchange-traded funds. The ProShares Short S&P500 (NYSEARCA: SH) plummeted as the squeeze intensified, catching many "macro bears" off-guard who had expected the 6,500 level to hold as firm resistance. Institutional players who had been using dark pools to accumulate shares—indicated by a Dark Index (DIX) reading above 55% in late March—saw their patience rewarded as the "hidden" demand finally translated into a public price breakout.
Brokerages and prime brokers also faced a bifurcated outcome. While the increased trading volume generated significant commission and fee income, the rapid move forced many clients into margin calls. The sheer speed of the 100-point move in the S&P 500 meant that those on the wrong side of the "gamma flip" had little time to react before their positions were liquidated, further adding to the upward pressure on the index.
Wider Market Significance and Historical Precedents
This event highlights a growing trend in the 2026 market: the "tail wags the dog." Derivatives positioning, rather than earnings or economic data, is increasingly the primary driver of short-term price action. The -$7.5 billion gamma imbalance is one of the largest recorded in recent years, drawing comparisons to the "Volmageddon" event of 2018 and the meme-stock frenzy of 2021. However, unlike those events, the April 1 squeeze occurred in the world's most liquid index, proving that even the S&P 500 is not immune to technical feedback loops.
The role of the "Dark Index" in this breakout also underscores a shift in institutional behavior. By parking capital in dark pools throughout Q1, institutions were able to accumulate large positions without alerting the broader market. When the gamma squeeze provided the spark, this "parked" liquidity acted as a solid floor, preventing any meaningful pullbacks during the ascent. This suggests that the "real" market sentiment was far more bullish than the public-facing exchange data suggested in March.
From a regulatory perspective, the April 1 event is likely to draw scrutiny from the SEC. The concentration of risk in the hands of a few major market makers and the "mechanical" nature of the rally raise questions about market stability. If a -$7.5 billion exposure can propel the market 2% in a day on rumors alone, the potential for a "Reverse Gamma Squeeze" (a rapid crash) is equally high should the positioning flip to the downside.
What Lies Ahead: The Post-6,500 Landscape
As of April 10, 2026, the S&P 500 has consolidated its gains, hovering around the 6,580 level. The immediate question for investors is whether this breakout is sustainable or if it was merely a "blow-off top." In the short term, the market remains in a "Positive Gamma" environment, which typically suppresses volatility as dealers now sell into rallies and buy into dips to maintain their hedges. This could lead to a period of sideways "theta decay" where the index remains range-bound.
Looking further ahead, the successful breach of 6,500 has shifted the technical outlook for the remainder of 2026. Many analysts are now eyeing the 7,000 mark by year-end, provided that the geopolitical situation remains stable and AI earnings continue to justify the premium valuations of the "Magnificent Seven." However, the "gamma traps" that fueled the April 1 rally are cyclical. As June options expiration approaches, investors should watch for another buildup in dealer exposure that could trigger a similar period of heightened volatility.
The strategic pivot for many funds now involves "Gamma-Neutral" strategies, seeking to avoid being caught in the next feedback loop. Retail investors are also increasingly using "zero-day to expiration" (0DTE) options to play these moves, which only adds more potential volatility to the mix. The market of 2026 is one where understanding the plumbing of the financial system—dealer Greeks, dark pool prints, and collar resets—is just as important as reading a balance sheet.
Summary and Key Takeaways
The April 1 breakout above 6,500 was a textbook example of a modern liquidity event. Driven by a -$7.5 billion negative gamma imbalance, the market was forced higher by the very entities—market makers—who are supposed to provide stability. The combination of dealer hedging, institutional accumulation in dark pools, and the clearing of the JPMorgan collar created a "perfect storm" that invalidated the bear case in a single trading session.
Moving forward, investors must recognize that the 6,500 level has transitioned from a formidable ceiling to a crucial floor. The market's ability to hold this level in the coming weeks will determine the trajectory of the 2026 bull run. While the "Gamma Rocket" provided an exhilarating ride for those long the market, it serves as a stark reminder of the underlying fragility and mechanical complexity of today's financial ecosystem.
In the months ahead, the key metrics to watch will be the Net Gamma Exposure (GEX) and the Dark Index (DIX). If the GEX slips back into deeply negative territory while the index is at all-time highs, the risk of a sharp, dealer-led correction will rise. For now, the bulls are in control, but they are riding a wave of derivatives that could just as easily turn into a riptide.
This content is intended for informational purposes only and is not financial advice.