Regional sporting goods retailer Big 5 Sporting Goods Corporation (NASDAQ: BGFV) stock has fallen since its $41.33 high in November 2021 as both top, and bottom lines continue to shrink. The company had a big surge during the post-pandemic reopening as team sports and live events resumed. However, 2022 was a challenging year for comps as inflationary pressures and economic uncertainty caused consumers to tighten their discretionary spending habits. These headwinds are expected to continue moving forward. Big 5 continues to experience normalization as the top and bottom deflate. This makes the dividend yield grow at the cost of shrinking share prices.
Sticking Out Like a Sore Thumb
Amongst the sports retailers, Big 5 sticks out like a sore thumb with its underperformance. The sports retailing industry has been predominantly strong heading into 2023. Big 5 has fallen (50%) in the past year while peers have seen double-digit gains. It continues to vastly underperform sports retailers like DICK’S Sporting Goods Inc. (NYSE: DKS) up 33%, Dilliard’s Inc. (NYSE: DDS) up 30%, Hibbett Inc. (NASDAQ: HIBB) up 38%, and Foot Locker Inc. (NYSE: FL) up 38% in the past year.
Big 5 could be getting squeezed out by its peers. The company issued downside guidance for Q4 2022 earnings estimates on Jan. 17, 2023. It lowered EPS estimates to $0.07 to $0.08 versus the $0.13 analyst estimate and way below its previous forecast of $0.29 at the end of Q2 2022.
Shrinkage Continues
On Feb. 28, 2022, Big 5 released its fiscal third-quarter 2022 results for the quarter ending September 2022. The company reported an earnings-per-share (EPS) profit of $0.08, beating estimates by $0.01. Net income was $1.7 million compared to $19.9 million in the year-ago period. Revenues fell (-9.7%) year-over-year (YoY) to $238.3 million, down from $273.4 million in the year-ago period. Same-store sales dropped (-13.2%) YoY. Q4 merchandise margins fell (129 bps) YoY but still remain up 300 bps compared to Q4 2019.
Big 5 CEO Steven Miller commented, “Looking at our current trending, while our seasonal winter products have performed well in the first quarter to date, macroeconomic conditions have continued to impact our customers’ discretionary spending.” The company will continue prioritizing margins and remaining nimble to combat inflationary pressures.
Is the Dividend in Jeopardy?
The over 12% dividend yield looks tempting, but revenue growth continues to normalize, falling nearly (10%). As EPS also shrinks, it depletes the company's cash with the hefty dividend payout. If EPS continues to fall, Big 5 may have to slash its dividend. However, it still pays the $0.25 per share dividend as of the March 10, 2023, ex-dividend date.
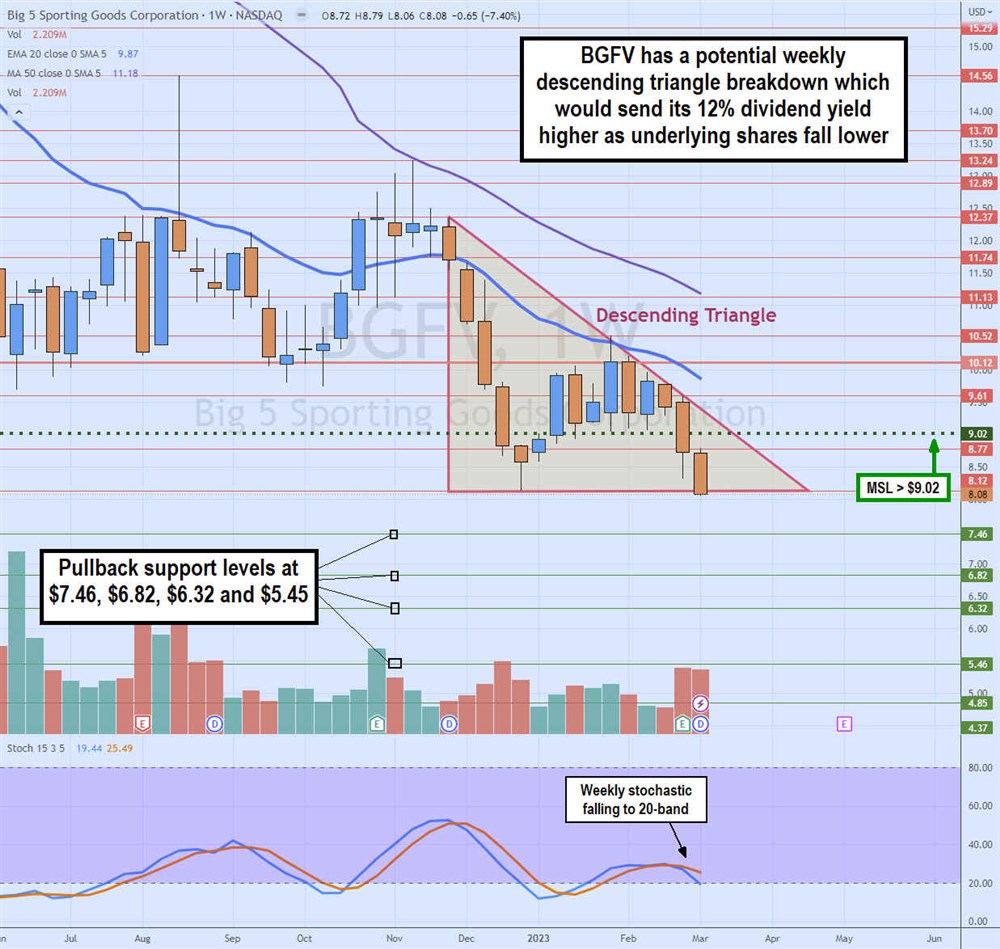
Weekly Descending Triangle Breakdown
The weekly candlestick chart on BGFV forms a second lower descending triangle. A descending triangle is characterized by having a flat bottom with sequentially lower highs intersecting trendlines at the apex. Shares are expected to collapse through the lower flat trendline or break out through the falling diagonal trendline.
This weekly descending triangle commenced after peaking at $12.27 in November 2022. BGFV fell for the next four weeks, reaching a low of $8.08. It triggered a weekly market structure low (MSL) bounce through $9.02 to peak at $10.52 in January 2023.
Every weekly candle made lower highs on the bounce attempts, eventually causing shares to fall back down to retest the flat bottom trendline at $8.12 again. The weekly stochastic has crossed down to test the 20-band.
The weekly exponential moving average (EMA) resistance continues to fall at $9.87, followed by the weekly 50-period MA resistance at $11.18. Pullback support levels are at $7.46, $6.82, $6.32, and $5.45.