All of the amounts disclosed in this press release are in U.S. dollars unless otherwise noted
TEL AVIV, Israel, Feb. 26, 2024 (GLOBE NEWSWIRE) -- Enlight Renewable Energy Ltd. (NASDAQ: ENLT, TASE: ENLT) today reported financial results for the fourth quarter and full year ended December 31, 2023. The Company’s earnings webcast will be held today at 8:00 AM ET. A link to this webcast can be found at the end of this earnings release.
| The entire suite of the Company’s 4Q23 financial results can be found on our IR website at https://enlightenergy.co.il/data/financial-reports/ |
Financial Highlights
12 months ending December 31, 2023
- Revenue of $256m, up 33% year over year
- Net income of $98m, up 157% year over year
- Adjusted EBITDA1 of $189m, up 45% year over year.
- Cash flow from operations of $150m, up 66% year over year.
3 months ending December 31, 2023
- Revenue of $74m, up 21% year over year
- Net income of $16m, up 48% year over year
- Adjusted EBITDA1 of $47m, up 8% year over year.
- Cash flow from operations of $24m, down 35% year over year.
________________________
1 The Company is unable to provide a reconciliation of Adjusted EBITDA to Net Income on a forward-looking basis without unreasonable effort because items that impact this IFRS financial measure are not within the Company’s control and/or cannot be reasonably predicted
Fourth Quarter Business Developments
Access to Capital
- Financial close of Atrisco Solar, including $300m of construction finance and $198m of tax equity commitments. Recycled $204m of excess equity capital.
- Financial close of Solar + Storage Cluster in Israel, including $211m of project finance debt. Returned $121m of excess equity capital.
- Secured additional corporate revolving credit facilities of $90m. The Company possesses total available revolving credit facilities of $260m, of which none were drawn as of the date of today’s report.
Portfolio Updates
- 76 MW and 142 MWh reached COD since last quarter’s earnings report; no material changes to the Mature Project portfolio since last quarter’s earnings report
- 543 MW and 1.6 GWh expected to COD in 2024; 1 GW and 2.9 GWh of new projects expected to commence construction in 2024
- 1.4 GW and 2.2 GWh of the Company’s PJM portfolio in the U.S. has entered the fast-track interconnection process, with minimal network upgrade costs. This represents a significant development milestone and highlights our continued success in identifying and securing attractive points of interconnection
“Our full year 2023 results reveal the strength of Enlight’s combined developer and IPP business model. Revenue grew by 33%, Adjusted EBITDA grew by 45% and Net Income by 157%, demonstrating our ability to deliver above-market growth and above-market returns. In a year of adversity across the renewable energy industry, our Company’s financial and operational performance stand out,” said Gilad Yavetz, CEO of Enlight Renewable Energy.
“Moreover, in 2023, we improved future project returns by amending PPAs and capturing the decline in equipment costs and interest rates. We also converted large portions of our rich development pipeline into Mature Projects, laying the foundation for our continued rapid growth. And finally, we secured various sources of capital, including project finance totaling more than half a billion dollars, under which $325m of excess equity was recycled back to the Company.”
“This sets the stage for 2024, a year in which we will take the next major step in realizing our growth plans. In 2024, we expect to commence construction on over 1 GW and 2.9 GWh of new projects, while reaching COD on over 0.5 GW and 1.6 GWh. Collectively these projects represent a growth of 84% above our current operational generation and 1,615% of our current operational energy storage capacity. And given the financing we secured in 2023, we have all the equity required to fund 2024’s activity, putting us in strong financial position for the year ahead.”
Overview of Financial and Operating Results: Revenue
| ($ thousands) | For the three-month period ended | For the twelve-month period ended | ||
| Segment | Dec. 31, 2023 | Dec. 31, 2022 | Dec. 31, 2023 | Dec. 31, 2022 |
| Israel | 20,738 | 10,910 | 67,687 | 51,363 |
| Central-Eastern Europe | 25,877 | 18,206 | 87,374 | 70,705 |
| Western Europe | 24,893 | 27,706 | 90,097 | 58,991 |
| USA | 309 | -- | 2,274 | -- |
| Management and Construction | 2,009 | 4,047 | 8,270 | 11,113 |
| Total Revenues | 73,826 | 60,869 | 255,702 | 192,172 |
In the fourth quarter of 2023, the Company’s revenues increased to $74m, up from $61m last year, a growth rate of 21% year over year. The Company benefited from the revenue contribution of new operational projects and inflation indexation embedded in PPAs for already operational projects. This was offset by a decline in revenues driven by lower electricity prices in Spain relative to the prices observed in the same quarter in 2022.
Since the fourth quarter of 2022, 487 MW and 277 MWh of projects started selling electricity, including Apex Solar in the U.S.; ACDC in Hungary; Genesis Wind in Israel and portions of the Solar & Storage cluster in Israel. The Company also benefited from the full ramp up of project Björnberget in Sweden which was immaterially operational in the fourth quarter of last year. These projects collectively generated $16m of revenue during the fourth quarter of 2023, with the biggest contributors being Björnberget $6m and Genesis Wind $9m. The Company also benefited from inflation indexation embedded in its PPAs, which contributed an additional $2m of revenue during the quarter. This reflected an average indexation of 7.2% across 592 MW of PPAs for projects that have been operational for a full year. There was no material net FX impact on the Company’s revenues this quarter.
Growth in revenues was offset by the decline in electricity prices for projects where electricity is sold under a merchant model, as well as slower-than-expected ramp up at Genesis Wind and Israel Solar + Storage cluster, which reached COD during the quarter. Gecama revenues fell year over year by 36% ($8m year over year), driven by lower power prices relative to last year and expectations. During the fourth quarter last year we sold electricity at Gecama at EUR 115 per MWh versus EUR 50 MWh for the same period this year.
Financial performance was well-balanced between Western Europe, Central-Eastern Europe (“CEE”) and Israel, with 68% of revenues in the fourth quarter of 2023 denominated in Euros, 3% in US Dollars, 1% in other European currencies, and 28% denominated in Israeli shekel.
In addition to the above, the Company sold $2m of electricity in projects treated as financial assets in the third quarter. Under IFRS this revenue is accounted for as financing income or other non-P&L metrics.
Net Income
In the fourth quarter of 2023, the Company’s net income increased to $16m, a growth rate of 48% year over year. Three non-cash items impacted our net income during the quarter. First was a loss of $8m attributed to the mark to market of interest rate hedges the Company entered into for the storage portion of Atrisco ahead of financial close anticipated later in 2024. The second was a reduction in the expectation for earnout payments linked to the acquisition of Clenera of $12m compared to a $5m increase during the same period in 2022. Finally, the strengthening of the Israeli Shekel caused a revaluation of foreign exchange-linked liabilities, with a negative impact of $5m. (All figures after tax.)
Adjusted EBITDA2
In the fourth quarter of 2023, the Company’s Adjusted EBITDA grew by 8% to $47m compared to $43m for the same period in 2022. The increase was driven by the same factors which affected our revenue increase. However, the y-o-y decline in revenues at Gecama, as well as the slower ramp up of projects in Israel, and the $3m increase in overhead, resulted in lower profit margins and slower growth in Adjusted EBITDA y-o-y. This was offset by the receipt of a final $2m stemming from the sale of a stake in the Faraday solar project, which closed in 3Q23.
________________________
2 The Company is unable to provide a reconciliation of Adjusted EBITDA to Net Income on a forward-looking basis without unreasonable effort because items that impact this IFRS financial measure are not within the Company’s control and/or cannot be reasonably predicted
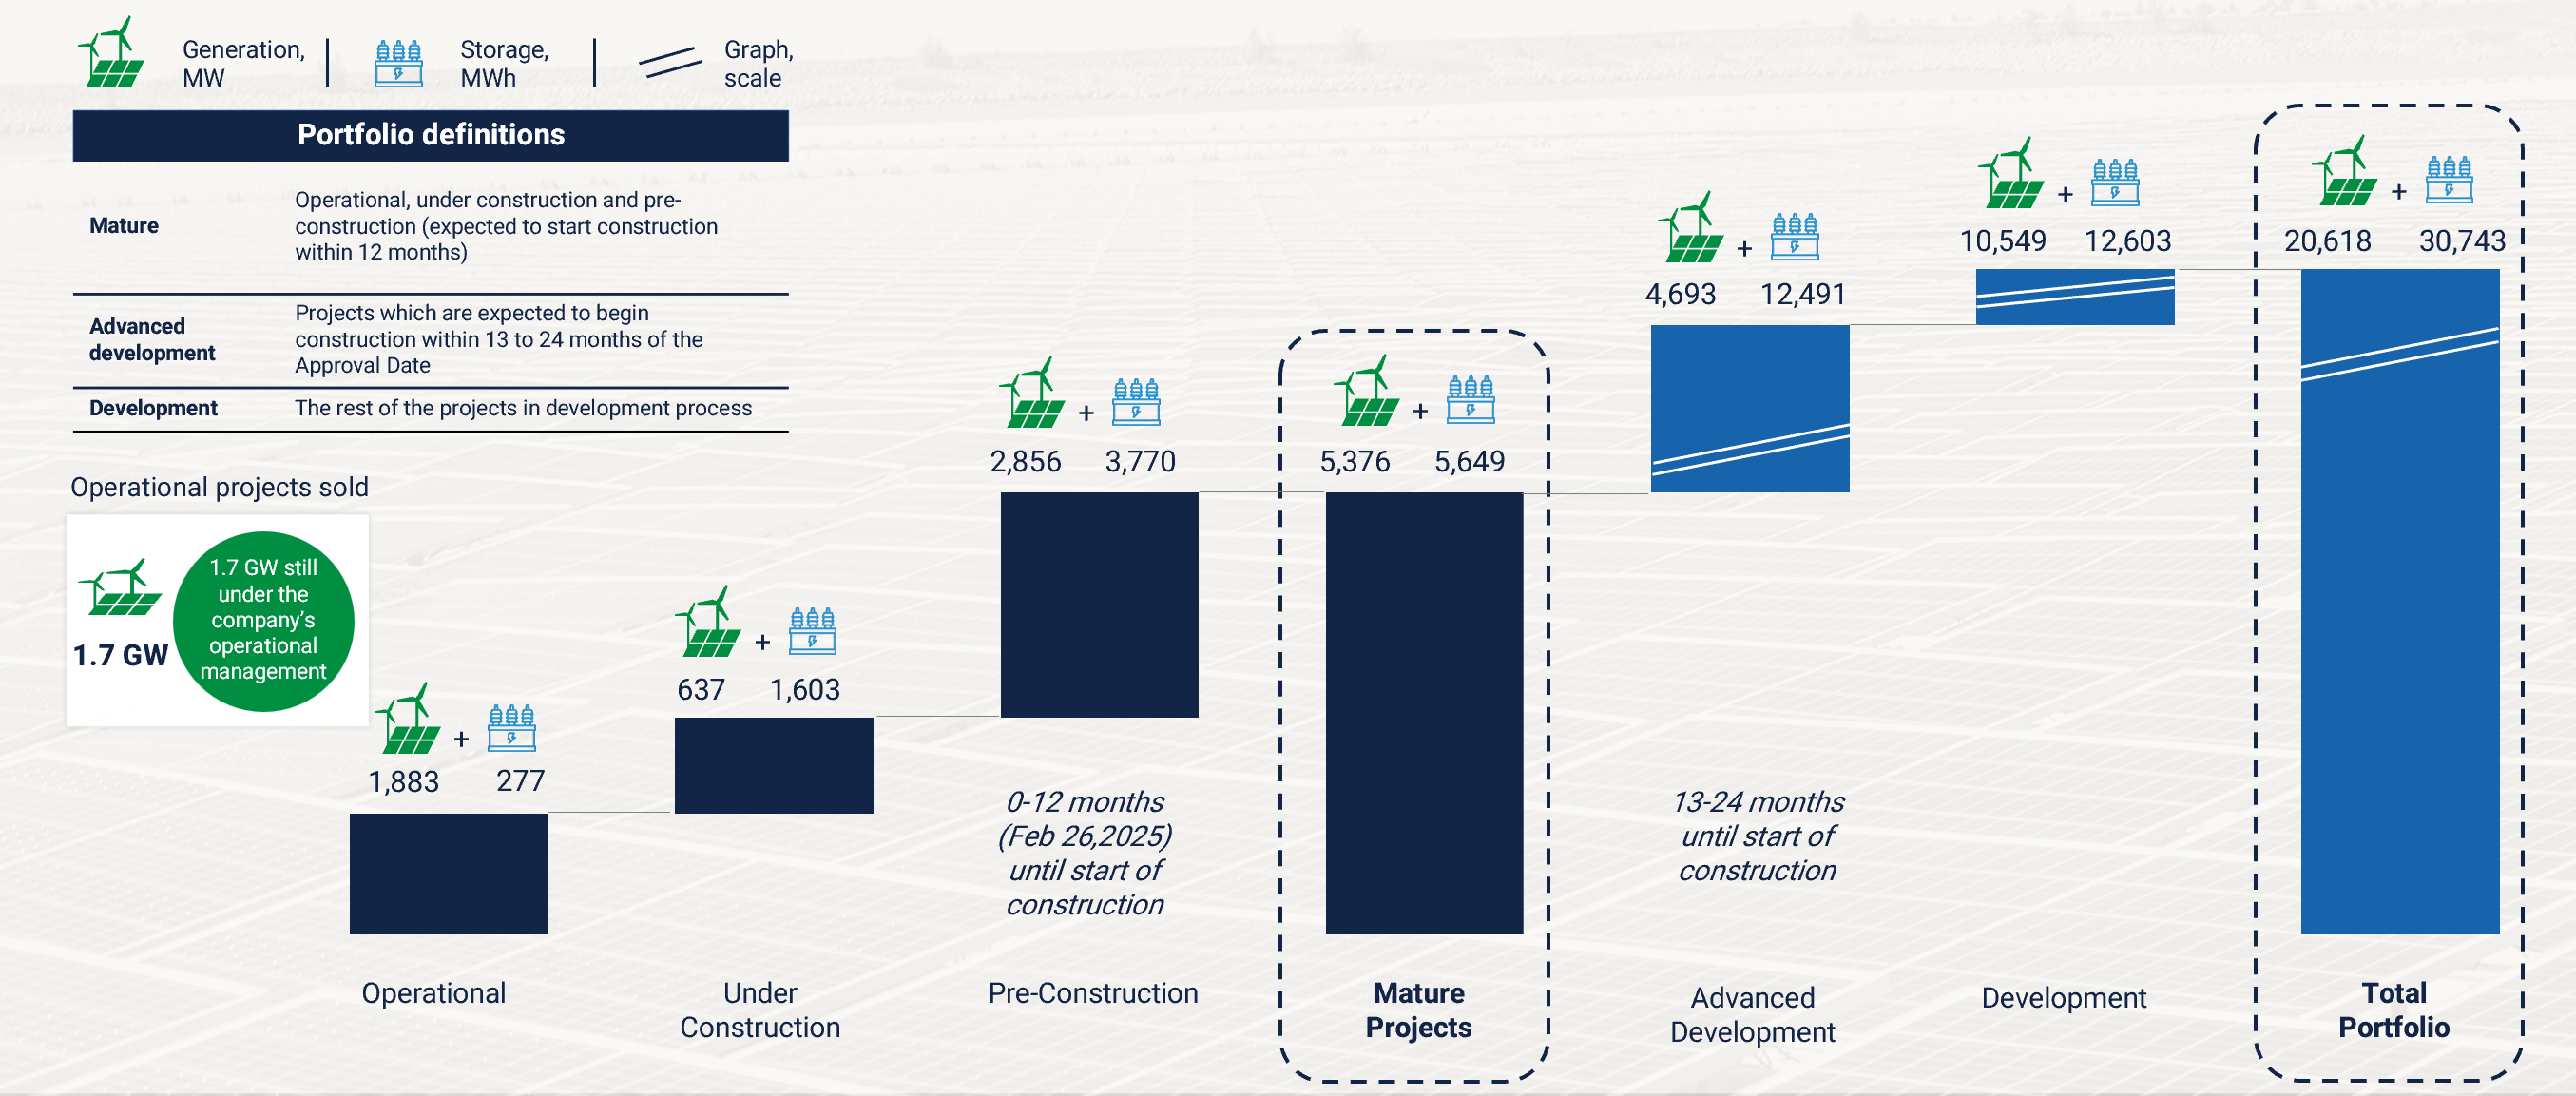
Portfolio Overview3
Key changes to the Company’s project portfolio during the fourth quarter of 2023:
- Operational portfolio grew by 76 MW and 142 MWh
- No material changes to the Mature Project portfolio
________________________
3 As of February 25, 2024
United States
The United States is Enlight’s largest market. A majority of the Company’s near-term Mature Portfolio and development portfolio is located in the US. In 2023, the Company reached COD on its first project in the United States, Apex Solar (106 MW). Moving into 2024, we expect a significant expansion within our U.S. activity, with major projects either expected to reach commercial operation or commence construction.
Atrisco is the Company’s first flagship project in the United States. The Project comprises 364 MW of solar and 1.2 GWh of battery and is located just outside Albuquerque, New Mexico. All project equipment is now installed, and work is underway to reach mechanical completion. Further, during the fourth quarter we closed tax equity and debt financing on Atrisco Solar, raising $300m of construction and term debt and $198m in PTC tax equity. The transaction, which released $204m of excess equity demonstrated our continued access to competitive project finance, including tax equity. On the storage portion of Atrisco, the Company reached a mutual resolution of the supplier matter described last quarter and is now advancing on both the construction and financial close of the project. The solar site is expected to reach COD in 3Q24, while the COD for the storage unit is expected during 4Q24.
In 2024, we also expect to commence construction on Quail Ranch (phase two of Atrisco), Roadrunner and Country Acres, totaling 806 MW of generation and over 2 GWh of energy storage. Financial close is expected on all three during the second half of 2024.The latter two projects were added to the Mature Portfolio just last year, highlighting the quality and depth of the Company’s pipeline.
| Project Name | Location | MW Generation | MWh Storage | Status | Expected COD |
| Quail Ranch | New Mexico | 120 | 400 | Pre-construction | H2/25 |
| Roadrunner | Arizona | 294 | 940 | Pre-construction | H2/25 |
| Country Acres | California | 392 | 688 | Pre-construction | H2/26 |
| Total | 806 | 2,028 |
In 2024, we are also focused on converting our earlier stage development projects into Mature Projects. In PJM, we are progressing with a total of 1.4 GW and 2.2 GWh of storage across Virgina, Michigan and North Carolina. In the fourth quarter of 2023, this set of projects was assessed by PJM to carry minimal network upgrade costs and was therefore moved to the interconnection fast track. Under this track, the projects expect to secure final interconnection agreements by the end of 2024, significantly substantiating their path to realization. Given rising power demand from data centers in PJM and high grid connection costs for competing projects in the region, our set of projects are uniquely positioned. In addition, we continue to see significant utility demand for solar and storage across the West. In an accelerating load growth environment, our 10 GW of advanced interconnection puts us in a prime position to capture rising customer demand at robust PPA pricing.
We continue to see a very supportive business environment. Costs for both solar panels and batteries have fallen significantly in recent months. Since the beginning of 2023 our solar module prices have dropped by approximately 25% and our battery prices by more than 30%. Following the peak in interest rates at almost 5% during 2H23, 10-year bond yields are now 4.3%, significantly easing financing costs and boosting our levered project returns. These positive trending fundamentals are adding more fuel to our prospects in the U.S. during 2024 and in the years ahead.
On a final note, Clenera will be undergoing a change in senior leadership as CEO and Co-Founder Jason Ellsworth will be stepping down at the end of June 2024. Adam Pishl, Co-Founder of Clenera and the company’s COO since inception in 2013, will assume the role of CEO.
Europe
Within Enlight’s operational portfolio in Europe, the Gecama wind project in Spain sold electricity at an average price of EUR 50 per MWh during 4Q23. Electricity prices have declined in Spain, amidst easing gas prices across Europe. In the fourth quarter, 45% of production was hedged at a baseload price of EUR 63 per MWh (EUR 44 net after capture rate), while the remainder was sold on a merchant basis at EUR 54 per MWh. Our effective selling price was lower than the hedge price because of the lower-than-expected capture rate. While the capture rate for the project was 91% on average during the first three quarters of 2023, it declined to 70% in the fourth quarter on the back of significant country-wide renewable generation. Windfall taxes amounted to EUR 7 per MWh during the quarter.
For 2024, the Company has hedged 65% of expected annual production at an average baseload price of EUR 100 per MWh. Electricity prices in Spain appear to have settled in the EUR 55-65 per MWh range for 2024, demonstrating the value of our hedge when compared to current spot and forward merchant rates. The fiscal framework in Spain has also been revised. The windfall tax (Royal Decree) that was introduced following sharp energy price increases in 2022 has been replaced in 2024 with a generation tax levied on revenues. Generation tax rates will start off at 3.5% of revenues and rise to 7.0% by the end of this year. This represents a return to the taxation framework that was in place when we initially built and financed Gecama.
The adjacent Gecama Hybrid Solar project with 225 MW of solar and 200 MWh of storage capacity is seeking to secure its environmental permit from regulatory authorities, which represents the site’s last major development milestone. Due to the protracted discussions, we now forecast the start of construction to occur during 2H24 from 1H24 previously, while COD is now forecasted for 4Q25, a six-month delay from our previous expectation. Though final development work is taking longer than we anticipated, the project stands to benefit from a significant drop in construction costs. Solar panels can now be obtained for $0.12-$0.13 a watt in Europe, while batteries are now available in the $150 per KWh range.
The Pupin wind farm in Serbia is advancing on schedule, with construction having begun in 2Q23. In 3Q23 the project secured an offtake agreement with the state-owned utility Elektroprivreda Srbije, structured as a 15-year inflation-linked contract for difference (“CFD”) for 72% of the 94 MW project output with a base rate of EUR 69 per MWh. Due to lower-than-expected balancing costs, expected profitability and returns for Pupin have risen. We continue to expect Pupin to reach COD during 2H25.
Finally, Tapolca, a solar project in Hungary with a capacity of 60 MW, is currently under construction and on schedule to reach COD by 2H24, in-line with expectations.
Israel
The build out of the Israel Solar + Storage clusters continued with the COD of Revivim 2, Arad Valley 2, and Ein Habesor since our last earnings release, for a total of 76 MW and 142 MWh. These projects join Arad Valley 1, Sde Nitzan and Haluziot 2 which came online earlier in 2023. In total, the project will comprise 12 sites in the north and center of Israel, with a total capacity of 248 MW and 593 MWh. We expect a gradual COD for the remaining 6 sites throughout 2024. During 4Q23, we reached financial close on this cluster of projects, raising $211m in debt at interest rate of 2.4% to 2.9% above Israeli nominal government bond yields. As a result, the Company recycled $121m of excess project equity back onto its balance sheet.
Starting in January 2024, the Israeli electricity market shifted to a fully deregulated market. Enlight has been preparing for this event for some time, signing corporate PPAs with the likes of Soda Stream, Applied Materials, and others, as well as engaging to supply electricity to Electra Power, a household-oriented power reseller. The Company has set up a dedicated internal division to expand activity in the sector and is the first firm in the country to complete direct-to-user sales of electricity under the new regulatory framework.
Finally, in February 2024, Enlight acquired 80% of the share capital of Aria, a renewable energy company engaged in the non-utility solar and storage segment in Israel, primarily focusing on municipal rooftop customers and agri-solar. This further deepens Enlight’s participation in Israel’s electricity market, and in this instance, provides the Company an entry into the non-utility segment in Israel, a fast-growing segment in which until now, Enlight was not active. Aira was acquired for an immaterial purchase price, though performance-based earnouts and options may lead to future total payments of up to approximately $20m over the coming five years.
Financing Arrangements
During 2023, Enlight achieved several important financing milestones. The most important of these was the financial close on the Atrisco Solar project in New Mexico and on the combined Solar and Storage Cluster in Israel, both of which occurred in 4Q23. In total, we secured $511m in financing from these two projects and recycled $325m of excess equity invested back to our balance sheet. In addition, the Company raised additional funds as follows:
- IPO of the Company on Nasdaq for $271m
- Sell down of our portion in the Faraday project in Utah for $13m
- Sell down on non-core generating assets in Israel for $6m
- Issuance of $83m in debentures in Israel
The amount of capital raised last year places the Company in a favorable financial position for 2024, and the Company does not anticipate the need to raise equity for our 2024 plan.
We also note that sell downs of projects from within our pipeline – whether Mature, Advanced Development, or Early-Stage Development– are to become an increasingly important source of funding, which we intend cultivate further in both 2024 and the years ahead.
Balance Sheet
The Company maintains $260m of revolving credit facilities, none of which have been drawn as of the date of today’s report. These resources enhance our financial strength and provide additional flexibility to the Company as it delivers on its Mature Project portfolio.
| ($ thousands) | December 31, 2023 | |
| Cash and Cash Equivalents: | ||
| Enlight Renewable Energy Ltd, Enlight EU Energies Kft, Enlight Renewable LLC and Enlight Finance excluding subsidiaries (“Topco”) | 258,312 | |
| Subsidiaries | 145,493 | |
| Deposits: | ||
| Short term deposits | 5,308 | |
| Restricted Cash: | ||
| Projects under construction | 142,695 | |
| Reserves, including debt service, performance obligations and others | 38,891 | |
| Total Cash | 590,699 |
2024 Financial Outlook
Details of the 2024 outlook include:
- Revenue between $335m and $360m
- Adjusted EBITDA4 between $235m and $255m
Our guidance reflects annual growth of 36% and 30% at the midpoint compared to 2023 respectively, demonstrating our accelerated growth path in 2024 and the years ahead.
Of our total forecasted revenues, 40% are expected to be denominated in Israeli Shekel, 55% Euros, and 5% in US Dollars. Given our large exposure to the Shekel and Euro and the current higher degree of volatility in these currencies, our guidance is predicated on an average annual exchange rate assumption of 3.8 Shekels to the Dollar and 1.05 Euros to the Dollar. In addition, 90% of 2024’s expected generation output will be sold at fixed prices either through hedges or PPAs.
________________________
4 The section titled “Non-IFRS Financial Measures�� below contains a description of Adjusted EBITDA, a non-IFRS financial measure discussed in this press release. A reconciliation between Adjusted EBITDA and Net Income, its most directly comparable IFRS financial measure, is contained in the tables below. The Company is unable to provide a reconciliation of Adjusted EBITDA to Net Income on a forward-looking basis without unreasonable effort because items that impact this IFRS financial measure are not within the Company’s control and/or cannot be reasonably predicted. These items may include, but are not limited to, forward-looking depreciation and amortization, share based compensation, other income, finance income, finance expenses, share of losses of equity accounted investees and taxes on income. Such information may have a significant, and potentially unpredictable, impact on the Company’s future financial results. We note that “Adjusted EBITDA” measures that we disclosed in previous filings in Israel were not comparable to “Adjusted EBITDA” disclosed in the release and in our future filings.
Conference Call Information
Enlight plans to hold its Fourth Quarter 2023 Conference Call and Webcast on Monday, February 26, 2024 at 8:00 a.m. ET to review its financial results and business outlook. Management will deliver prepared remarks followed by a question-and-answer session. Participants can join by conference call or webcast:
- Conference Call: Please pre-register by conference call: https://register.vevent.com/register/BIed62b0d5cf024de09257715b035083b9
Upon registering, you will be emailed a dial-in number, direct passcode and unique PIN. - Webcast:
Please register and join by webcast https://edge.media-server.com/mmc/p/eb2fvjtp
The press release with the financial results as well as the investor presentation materials will be accessible from the Company’s website prior to the conference call. Approximately one hour after completion of the live call, an archived version of the webcast will be available on the Company’s investor relations website at https://enlightenergy.co.il/info/investors/.
Supplemental Financial and Other Information
We intend to announce material information to the public through the Enlight investor relations website at https://enlightenergy.co.il/info/investors, SEC filings, press releases, public conference calls, and public webcasts. We use these channels to communicate with our investors, customers, and the public about our company, our offerings, and other issues. As such, we encourage investors, the media, and others to follow the channels listed above, and to review the information disclosed through such channels. Any updates to the list of disclosure channels through which we will announce information will be posted on the investor relations page of our website.
Non-IFRS Financial Measures
This release presents Adjusted EBITDA, a financial metric, which is provided as a complement to the results provided in accordance with the International Financial Reporting Standards as issued by the International Accounting Standards Board (“IFRS”). A reconciliation of the non-IFRS financial information to the most directly comparable IFRS financial measure is provided in the accompanying tables found at the end of this release.
We define Adjusted EBITDA as net income (loss) plus depreciation and amortization, share based compensation, finance expenses, taxes on income and share in losses of equity accounted investees and minus finance income and non-recurring other income. Non-recurring other income for the fourth quarter of 2023 included income recognized in relation to the reduction of earnout we expect to pay as part of the Clenera Acquisition and other income recognized in relation to tax credits for projects in the United States. With respect to other expense (income), as part of Enlight’s strategy to accelerate growth and reduce the need for equity financing, the Company sells parts of, or entire, developed assets from time to time, and therefore includes realized gains and losses from these asset dispositions in Adjusted EBITDA. Our management believes Adjusted EBITDA is indicative of operational performance and ongoing profitability and uses Adjusted EBITDA to evaluate the operating performance and for planning and forecasting purposes.
Non-IFRS financial measures have limitations as analytical tools and should not be considered in isolation or as substitutes for financial information presented under IFRS. There are a number of limitations related to the use of non-IFRS financial measures versus comparable financial measures determined under IFRS. For example, other companies in our industry may calculate the non-IFRS financial measures that we use differently or may use other measures to evaluate their performance. All of these limitations could reduce the usefulness of our non-IFRS financial measures as analytical tools. Investors are encouraged to review the related IFRS financial measure, Net Income, and the reconciliations of Adjusted EBITDA provided below to Net Income and to not rely on any single financial measure to evaluate our business.
Special Note Regarding Forward-Looking Statements
This press release contains forward-looking statements within the meaning of the U.S. Private Securities Litigation Reform Act of 1995. We intend such forward-looking statements to be covered by the safe harbor provisions for forward-looking statements as contained in Section 27A of the Securities Act of 1933, as amended, and Section 21E of the Securities Exchange Act of 1934, as amended. All statements contained in this press release other than statements of historical fact, including, without limitation, statements regarding the Company’s business strategy and plans, capabilities of the Company’s project portfolio and achievement of operational objectives, market opportunity, utility demand and potential growth, discussions with commercial counterparties and financing sources, pricing trends for materials, progress of Company projects, including anticipated timing of related approvals and project completion and anticipated production delays, the Company’s future financial results, expected impact from various regulatory developments, expectations regarding wind production, electricity prices and windfall taxes, the potential impact of the current conflicts in Israel on our operations and financial condition and Company actions designed to mitigate such impact, and Revenue and Adjusted EBITDA guidance, the expected timing of completion of our ongoing projects, and the Company’s anticipated cash requirements and financing plans , are forward-looking statements. The words “may,” “might,” “will,” “could,” “would,” “should,” “expect,” “plan,” “anticipate,” “intend,” “target,” “seek,” “believe,” “estimate,” “predict,” “potential,” “continue,” “contemplate,” “possible,” “forecasts,” “aims” or the negative of these terms and similar expressions are intended to identify forward-looking statements, though not all forward-looking statements use these words or expressions.
These statements are neither promises nor guarantees, but involve known and unknown risks, uncertainties and other important factors that may cause our actual results, performance or achievements to be materially different from any future results, performance or achievements expressed or implied by the forward-looking statements, including, but not limited to, the following: our ability to site suitable land for, and otherwise source, renewable energy projects and to successfully develop and convert them into Operational Projects; availability of, and access to, interconnection facilities and transmission systems; our ability to obtain and maintain governmental and other regulatory approvals and permits, including environmental approvals and permits; construction delays, operational delays and supply chain disruptions leading to increased cost of materials required for the construction of our projects, as well as cost overruns and delays related to disputes with contractors; our suppliers’ ability and willingness to perform both existing and future obligations; competition from traditional and renewable energy companies in developing renewable energy projects; potential slowed demand for renewable energy projects and our ability to enter into new offtake contracts on acceptable terms and prices as current offtake contracts expire; offtakers’ ability to terminate contracts or seek other remedies resulting from failure of our projects to meet development, operational or performance benchmarks; various technical and operational challenges leading to unplanned outages, reduced output, interconnection or termination issues; the dependence of our production and revenue on suitable meteorological and environmental conditions, and our ability to accurately predict such conditions; our ability to enforce warranties provided by our counterparties in the event that our projects do not perform as expected; government curtailment, energy price caps and other government actions that restrict or reduce the profitability of renewable energy production; electricity price volatility at assets with merchant exposure, unusual weather conditions (including the effects of climate change, could adversely affect wind and solar conditions), catastrophic weather-related or other damage to facilities, unscheduled generation outages, maintenance or repairs, unanticipated changes to availability due to higher demand, shortages, transportation problems or other developments, environmental incidents, or electric transmission system constraints and the possibility that we may not have adequate insurance to cover losses as a result of such hazards; our dependence on certain operational projects for a substantial portion of our cash flows; our ability to continue to grow our portfolio of projects through successful acquisitions; changes and advances in technology that impair or eliminate the competitive advantage of our projects or upsets the expectations underlying investments in our technologies; our ability to effectively anticipate and manage cost inflation, interest rate risk, currency exchange fluctuations (such as recent declines in the value of the Israeli shekel following Hamas’ attacks against Israel) and other macroeconomic conditions that impact our business; our ability to retain and attract key personnel; our ability to manage legal and regulatory compliance and litigation risk across our global corporate structure; our ability to protect our business from, and manage the impact of, cyber-attacks, disruptions and security incidents, as well as acts of terrorism or war; changes to existing renewable energy industry policies and regulations that present technical, regulatory and economic barriers to renewable energy projects; the reduction, elimination or expiration of government incentives for, or regulations mandating the use of, renewable energy; our ability to effectively manage our supply chain and comply with applicable regulations with respect to international trade relations, tariffs, sanctions, export controls and anti-bribery and anti-corruption laws; our ability to effectively comply with Environmental Health and Safety and other laws and regulations and receive and maintain all necessary licenses, permits and authorizations; our performance of various obligations under the terms of our indebtedness (and the indebtedness of our subsidiaries that we guarantee) and our ability to continue to secure project financing on attractive terms for our projects; limitations on our management rights and operational flexibility due to our use of tax equity arrangements; potential claims and disagreements with partners, investors and other counterparties that could reduce our right to cash flows generated by our projects; our ability to comply with tax laws of various jurisdictions in which we currently operate as well as the tax laws in jurisdictions in which we intend to operate in the future; the unknown effect of the dual listing of our ordinary shares on the price of our ordinary shares; various risks related to our incorporation and location in Israel, including with respect to the ongoing war with Hamas and conflicts with other hostile groups; the costs and requirements of being a public company, including the diversion of management’s attention with respect to such requirements; certain provisions in our Articles of Association and certain applicable regulations that may delay or prevent a change of control; and other risk factors set forth in the section titled “Risk factors” in our Annual Report on Form 20-F for the fiscal year ended December 31, 2022, filed with the Securities and Exchange Commission (the “SEC”), as may be updated in our other documents filed with or furnished to the SEC, including our Annual Report on Form 20-F for the fiscal year ended December 31, 2023, to be filed with the SEC.
These statements reflect management’s current expectations regarding future events and operating performance and speak only as of the date of this press release. You should not put undue reliance on any forward-looking statements. Although we believe that the expectations reflected in the forward-looking statements are reasonable, we cannot guarantee that future results, levels of activity, performance and events and circumstances reflected in the forward-looking statements will be achieved or will occur. Except as required by applicable law, we undertake no obligation to update or revise publicly any forward-looking statements, whether as a result of new information, future events or otherwise, after the date on which the statements are made or to reflect the occurrence of unanticipated events.
About Enlight
Founded in 2008, Enlight develops, finances, constructs, owns, and operates utility-scale renewable energy projects. Enlight operates across the three largest renewable segments today: solar, wind and energy storage. A global platform, Enlight operates in the United States, Israel and 9 European countries. Enlight has been traded on the Tel Aviv Stock Exchange since 2010 (TASE: ENLT) and completed its U.S. IPO (Nasdaq: ENLT) in 2023.
Investor Contact
Yonah Weisz
Director IR
investors@enlightenergy.co.il
Erica Mannion or Mike Funari
Sapphire Investor Relations, LLC
+1 617 542 6180
investors@enlightenergy.co.il
A chart accompanying this announcement is available at https://www.globenewswire.com/NewsRoom/AttachmentNg/b3b2c17a-0151-449f-8cae-13c5a6d7f334
Appendix 1 – Financial information
| Consolidated Statements of Income | ||||
| For the year ended at December 31 | ||||
| 2023 | 2022 | |||
| USD in | USD in | |||
| Thousands | Thousands | |||
| Revenues | 255,702 | 192,172 | ||
| Cost of sales | (52,794) | (40,438) | ||
| Depreciation and amortization | (63,849) | (40,563) | ||
| Gross profit | 139,059 | 111,171 | ||
| General and administrative expenses | (33,303) | (28,739) | ||
| Development expenses | (6,347) | (5,587) | ||
| Other income | 58,734 | 13,767 | ||
| 19,084 | (20,559) | |||
| Operating profit | 158,143 | 90,612 | ||
| Finance income | 36,799 | 23,341 | ||
| Finance expenses | (68,143) | (62,591) | ||
| Total finance expenses, net | (31,344) | (39,250) | ||
| Profit before tax and equity loss | 126,799 | 51,362 | ||
| Share of losses of equity accounted investees | (330) | (306) | ||
| Profit before income taxes | 126,469 | 51,056 | ||
| Taxes on income | (28,428) | (12,943) | ||
| Profit for the year | 98,041 | 38,113 | ||
| Profit for the period attributed to: | ||||
| Owners of the Company | 70,924 | 24,749 | ||
| Non-controlling interests | 27,117 | 13,364 | ||
| 98,041 | 38,113 | |||
| Earnings per ordinary share (in USD) | ||||
| with a par value of NIS 0.1, attributable to | ||||
| owners of the parent Company: | ||||
| Basic earnings per share | 0.61 | 0.25 | ||
| Diluted earnings per share | 0.57 | 0.25 | ||
| Weighted average of share capital used in the | ||||
| calculation of earnings: | ||||
| Basic per share | 115,721,346 | 97,335,870 | ||
| Diluted per share | 123,861,293 | 99,978,133 | ||
| Consolidated Statements of Financial Position as of | ||||
| December 31 | December 31 | |||
| 2023 | 2022 | |||
| USD in | USD in | |||
| Thousands | Thousands | |||
| Assets | ||||
| Current assets | ||||
| Cash and cash equivalents | 403,805 | 193,869 | ||
| Deposits in banks | 5,308 | 4,054 | ||
| Restricted cash | 142,695 | 92,103 | ||
| Financial assets at fair value through profit or loss | - | 33,895 | ||
| Trade receivables | 43,100 | 39,822 | ||
| Other receivables | 60,691 | 36,953 | ||
| Current maturities of contract assets | 8,070 | 7,622 | ||
| Current maturities of loans to investee entities | - | 13,893 | ||
| Other financial assets | 976 | 1,493 | ||
| Total current assets | 664,645 | 423,704 | ||
| Non-current assets | ||||
| Restricted cash | 38,891 | 38,728 | ||
| Other long term receivables | 32,540 | 6,542 | ||
| Deferred costs in respect of projects | 271,424 | 205,575 | ||
| Deferred borrowing costs | 493 | 6,519 | ||
| Loans to investee entities | 35,878 | 14,184 | ||
| Contract assets | 91,346 | 99,152 | ||
| Fixed assets, net | 2,947,369 | 2,220,734 | ||
| Intangible assets, net | 287,961 | 279,717 | ||
| Deferred taxes assets | 9,134 | 4,683 | ||
| Right-of-use asset, net | 121,348 | 96,515 | ||
| Financial assets at fair value through profit or loss | 53,466 | 42,918 | ||
| Other financial assets | 79,426 | 94,396 | ||
| Total non-current assets | 3,969,276 | 3,109,663 | ||
| Total assets | 4,633,921 | 3,533,367 | ||
| Consolidated Statements of Financial Position as of (Cont.) | ||||
| December 31 | December 31 | |||
| 2023 | 2022 | |||
| USD in | USD in | |||
| Thousands | Thousands | |||
| Liabilities and equity | ||||
| Current liabilities | ||||
| Credit and current maturities of loans from banks and other financial institutions | 324,666 | 165,627 | ||
| Trade payables | 105,574 | 34,638 | ||
| Other payables | 103,622 | 77,864 | ||
| Current maturities of debentures | 26,233 | 15,832 | ||
| Current maturities of lease liability | 8,113 | 5,850 | ||
| Financial liabilities through profit or loss | 13,860 | 35,283 | ||
| Other financial liabilities | 1,224 | 50,255 | ||
| Total current liabilities | 583,292 | 385,349 | ||
| Non-current liabilities | ||||
| Debentures | 293,751 | 238,520 | ||
| Other financial liabilities | 62,020 | - | ||
| Convertible debentures | 130,566 | 131,385 | ||
| Loans from banks and other financial institutions | 1,702,925 | 1,419,057 | ||
| Loans from non-controlling interests | 92,750 | 90,908 | ||
| Financial liabilities through profit or loss | 34,524 | 48,068 | ||
| Deferred taxes liabilities | 44,941 | 14,133 | ||
| Employee benefits | 4,784 | 12,238 | ||
| Lease liability | 119,484 | 93,773 | ||
| Other payables | 60,880 | - | ||
| Asset retirement obligation | 68,047 | 49,902 | ||
| Total non-current liabilities | 2,614,672 | 2,097,984 | ||
| Total liabilities | 3,197,964 | 2,483,333 | ||
| Equity | ||||
| Ordinary share capital | 3,293 | 2,827 | ||
| Share premium | 1,028,532 | 762,516 | ||
| Capital reserves | 57,730 | 30,469 | ||
| Proceeds on account of convertible options | 15,494 | 15,496 | ||
| Accumulated profit (loss) | 63,710 | (7,214) | ||
| Equity attributable to shareholders of the Company | 1,168,759 | 804,094 | ||
| Non-controlling interests | 267,198 | 245,940 | ||
| Total equity | 1,435,957 | 1,050,034 | ||
| Total liabilities and equity | 4,633,921 | 3,533,367 | ||
| Consolidated Statements of Cash Flows | ||||
| For the year ended at December 31 | ||||
| 2023 | 2022 | |||
| USD in | USD in | |||
| Thousands | Thousands | |||
| Cash flows for operating activities | ||||
| Profit for the year | 98,041 | 38,113 | ||
| Income and expenses not associated with cash flows: | ||||
| Depreciation and amortization | 65,796 | 42,267 | ||
| Finance expenses (income), net | (5,874) | 24,590 | ||
| Share-based compensation | 4,970 | 8,673 | ||
| Taxes on income | 28,428 | 12,943 | ||
| Other (income) expenses, net | (17,750) | 31 | ||
| Company’s share in losses of investee partnerships | 330 | 306 | ||
| 75,900 | 88,810 | |||
| Changes in assets and liabilities items: | ||||
| Change in other receivables | (3,241) | (4,930) | ||
| Change in trade receivables | (2,841) | (23,355) | ||
| Change in other payables | 6,382 | 5,738 | ||
| Change in trade payables | 15,474 | 784 | ||
| 15,774 | (21,763) | |||
| Interest receipts | 12,490 | 4,461 | ||
| Interest paid | (54,469) | (33,123) | ||
| Income Tax paid | (12,236) | (3,700) | ||
| Repayment of contract assets | 14,120 | 17,578 | ||
| Net cash from operating activities | 149,620 | 90,376 | ||
| Cash flows for investing activities | ||||
| Acquisition of consolidated entities | (6,975) | (56,962) | ||
| Changes in restricted cash and bank deposits, net | (53,131) | (86,055) | ||
| Purchase, development, and construction in respect of projects | (730,976) | (656,143) | ||
| Proceeds from sale (purchase) of short-term financial assets measured at fair value through profit or loss, net | 32,601 | (1,881) | ||
| Loans provided and Investment in investee | (28,174) | (4,147) | ||
| Payments on account of acquisition of consolidated company | (5,728) | (3,988) | ||
| Purchase of long-term financial assets measured at fair value through profit or loss | (5,682) | (10,824) | ||
| Net cash used in investing activities | (798,065) | (820,000) | ||
| Consolidated Statements of Cash Flows (Cont.) | ||||
| For the year ended at December 31 | ||||
| 2023 | 2022 | |||
| USD in | USD in | |||
| Thousands | Thousands | |||
| Cash flows from financing activities | ||||
| Receipt of loans from banks and other financial institutions | 623,927 | 541,024 | ||
| Repayment of loans from banks and other financial institutions | (203,499) | (109,130) | ||
| Issuance of debentures | 83,038 | - | ||
| Issuance of convertible debentures | - | 47,755 | ||
| Repayment of debentures | (14,735) | (16,571) | ||
| Dividends and distributions by subsidiaries to non-controlling | (13,328) | (2,927) | ||
| interests | ||||
| Proceeds in respect of derivative financial instruments | - | 7,820 | ||
| Proceeds from investments by tax-equity investors | 198,758 | - | ||
| Repayment of tax equity investment | (82,721) | - | ||
| Deferred borrowing costs | (1,984) | (4,957) | ||
| Receipt of loans from non-controlling interests | 274 | 18,136 | ||
| Repayment of loans from non-controlling interests | (1,485) | (2,302) | ||
| Consideration from sale of holding in consolidated entity, without Loss of control | - | 4,160 | ||
| Prepayments on account of issuance of shares | - | (1,750) | ||
| Issuance of shares | 266,451 | 206,625 | ||
| Exercise of share options | 9 | 8 | ||
| Repayment of lease liability | (4,848) | (4,327) | ||
| Proceeds from investment in entities by non- controlling interest | 5,448 | 1,177 | ||
| Net cash from financing activities | 855,305 | 684,741 | ||
| Increase (Decrease) in cash and cash equivalents | 206,860 | (44,883) | ||
| Balance of cash and cash equivalents at beginning of year | 193,869 | 265,933 | ||
| Effect of exchange rate fluctuations on cash and cash equivalents | 3,076 | (27,181) | ||
| Cash and cash equivalents at end of year | 403,805 | 193,869 | ||
Segmental Reporting
| For the year ended December 31, 2023 | ||||||||||||||||
| Israel | Central- Eastern Europe | Western Europe | USA | Management and construction | Total reportable segments | Adjustments | Total | |||||||||
| USD in thousands | ||||||||||||||||
| External revenues | 67,687 | 87,374 | 90,097 | 2,274 | 8,270 | 255,702 | - | 255,702 | ||||||||
| Inter-segment revenues | - | - | - | - | 9,074 | 9,074 | (9,074) | - | ||||||||
| Total revenues | 67,687 | 87,374 | 90,097 | 2,274 | 17,344 | 264,776 | (9,074) | 255,702 | ||||||||
| Segment Adjusted | ||||||||||||||||
| EBITDA | 66,680 | 72,629 | 78,048 | 1,518 | 3,035 | 221,910 | - | 221,910 | ||||||||
| Reconciliations of unallocated amounts: | ||||||||||||||||
| Headquarter costs (*) | (30,434 | ) | ||||||||||||||
| Gains from projects disposals | 9,847 | |||||||||||||||
| Intersegment profit | 1,587 | |||||||||||||||
| Repayment of contract asset under concession arrangements | (14,120 | ) | ||||||||||||||
| Depreciation and amortization and share based compensation | (70,766 | ) | ||||||||||||||
| Other incomes not attributed to segments | 40,119 | |||||||||||||||
| Operating profit | 158,143 | |||||||||||||||
| Finance income | 36,799 | |||||||||||||||
| Finance expenses | (68,143 | ) | ||||||||||||||
| Share in the losses of equity accounted investees | (330 | ) | ||||||||||||||
| Profit before income taxes | 126,469 | |||||||||||||||
(*) Including general and administrative and development expenses (excluding depreciation and amortization and share based compensation).
Segmental Reporting (cont.)
| For the year ended December 31, 2022 | |||||||||||||||
| Israel | Central- Eastern Europe | Western Europe | Management and construction | Total reportable segments | Adjustments | Total | |||||||||
| USD in thousands | |||||||||||||||
| External revenues | 51,363 | 70,705 | 58,991 | 11,113 | 192,172 | - | 192,172 | ||||||||
| Inter-segment revenues | - | - | - | 9,111 | 9,111 | (9,111 | ) | - | |||||||
| Total revenues | 51,363 | 70,705 | 58,991 | 20,224 | 201,283 | (9,111 | ) | 192,172 | |||||||
| Segment Adjusted | |||||||||||||||
| EBITDA | 57,598 | 56,181 | 45,750 | 4,018 | 163,547 | - | 163,547 | ||||||||
| Reconciliations of unallocated amounts: | |||||||||||||||
| Headquarter costs (*) | (18,071 | ) | |||||||||||||
| Intersegment profit | 2,038 | ||||||||||||||
| Repayment of contract asset under concession arrangements | (17,579 | ) | |||||||||||||
| Depreciation and amortization and share based compensation | (50,940 | ) | |||||||||||||
| Other incomes not attributed to segments | 11,617 | ||||||||||||||
| Operating profit | 90,612 | ||||||||||||||
| Finance income | 23,341 | ||||||||||||||
| Finance expenses | (62,591 | ) | |||||||||||||
| Share in the losses of equity accounted investees | (306 | ) | |||||||||||||
| Profit before income taxes | 51,056 | ||||||||||||||
(*) Including general and administrative and development expenses (excluding depreciation and amortization and share based compensation).
Appendix 2 - Reconciliations between Net Income to Adjusted EBITDA
| ($ thousands) | For the year ended at | For the three months ended at | ||||||
| 12/31/23 | 12/31/22 | 12/31/23 | 12/31/22 | |||||
| Net Income (loss) | 98,041 | 38,113 | 16,202 | 10,955 | ||||
| Depreciation and amortization | 65,796 | 42,267 | 21,611 | 13,454 | ||||
| Share based compensation | 4,970 | 8,673 | 970 | 1,140 | ||||
| Finance income | (36,799) | (23,341) | 7,581 | (4,160) | ||||
| Finance expenses | 68,143 | 62,591 | 16,344 | 12,126 | ||||
| Non-recurring other income (*) | (40,119) | (11,617) | (18,981) | 5,846 | ||||
| Share of losses of equity accounted investees | 330 | 306 | (137) | 234 | ||||
| Taxes on income | 28,428 | 12,943 | 2,934 | 3,619 | ||||
| Adjusted EBITDA | 188,790 | 129,935 | 46,524 | 43,214 | ||||
* Non-recurring other income comprised the recognition of income related to reduced earnout payments expected to be incurred for the acquisition of Clenera for early-stage projects and other income recognized in relation to tax credits for projects in the United States

![]()


