Buyers Walk Away from Half of Evaluated Deals; 87% Due To Misaligned Valuation Expectations
Valuation Multiples Increase; Along with Median AUM of Acquired Firm Rising from $250M to $400M
Fidelity Investments® 2023 M&A Valuation & Deal Structure Survey revealed a 237% increase in registered investment advisor (RIA) M&A deals, with 492 reported transactions, up from 146 for the 2017- 2019 study period. The survey, which examines trends and buyer perceptions related to RIA M&A transactions, also uncovered that buyers reported larger deals vs. the previous study period, with the median AUM of acquired firms increasing from $250M to $400M.
This press release features multimedia. View the full release here: https://www.businesswire.com/news/home/20230627945915/en/
(Graphic: Business Wire)
The study, which was last conducted in 2019, surveyed serial acquirers involved in nearly 500 deals over the last three years and accounted for virtually 75% of all RIA transactions tracked by Fidelity during that time.i
“Despite market headwinds, the wealth management industry continues to be a vibrant space for M&A, with the environment rewarding high-quality firms with strong multiples,” said Laura Delaney, Fidelity’s vice president of practice management & consulting. “Although activity has increased substantially vs. the previous study period, it’s important for RIA business owners to align on valuation drivers and understand the dynamics involved in the motivations and expectations of buyers and sellers.”
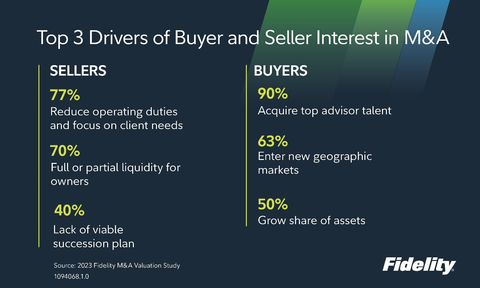
Motivations of Buyers and Sellers Differ
The research revealed that when it comes to making a deal, buyers and sellers come to the table with differing motivations and expectations.
If buyers and sellers can better understand each other’s key motivations, each can ensure they are effectively communicating the value their firm brings to the table.
Misalignment on Deal Valuation
According to respondents, deals have been closing at a swifter pace with an average deal completion time of roughly seven months for the last three years, down from nine months in the 2017-2019 period. However, more than one in three buyers agreed that recent market volatility has affected deal completion time.
When asked about deal sourcing, the majority of firms reported they were either sourced by in-house experts or investment bankers. Nearly half (45%) of firms disclosed that deals were financed using in-house capital, with a quarter reporting the use of private equity partners or draw loans.
Buyers reported walking away from roughly half (52%) of evaluated deals. The key drivers leading to this were the misalignment of: valuation expectations (87%), culture (73%) and the firm’s vision (50%).
Of the deals which fell through specifically due to sellers’ unrealistic valuation expectations, unrealistic comparison multiples (83%), the lack of understanding of valuation drivers (77%), and being too close to the business to see weaknesses (47%) were the major factors leading sellers to overvalue their business. Interestingly, nearly half of sellers (49%) utilized a third-party for firm valuation. From a buyer’s point of view, 33% of deals had higher valuations for firms who used a third-party vs. comparable firms who self-calculated.
“The nature of deals will continue to evolve,” added Delaney. “We’re seeing strategic acquirers become increasingly efficient which is reflected in reported deal completion time, however, opportunity can be left on the table due to misalignment of dealmaking fundamentals. There’s an element of emotion behind every transaction.”
When asked about expected deal activity in the next five years, three out of five firms plan to do more deals. This stems from: 1.) a fragmented wealth management industry, 2.) advisors continuing to age out of the business, and 3.) firms continually seeking access to talent and scale, among other things.
Economic Factors Impact Deal Structure
The study also examined changes in deal structure and found that buyers have evaluated nearly four times as many deals since January 2020, with median deal size increasing from ~$250M in the 2019 study period to ~$400M in the 2023 period (60% increase), and revenue multiples climbing from ~2.25x to ~3.25x. Median EBITDA (earnings before interest, tax, depreciation and amortization) multiples also increased from ~7x to ~9x, with sellers’ expected EBITDA multiples rising from ~9x to ~11x in the past three years. The reported drivers of this increase include high organic growth, young and aggressive G2 (next-generation leader/partner), and a key geographical footprint. Firms identified increasing interest rates, significant private equity capital entering the market, and more demand as an increasing number of players are competing for the same business, as some of the reasons for the change in EBITDA multiples vs. three years ago.
The M&A Valuation & Deal Structure Survey is an example of how Fidelity’s interconnected, yet diverse business model gives the company unique insights into the industry. For more information, please visit the M&A Valuation and Deal Structure Report. Fidelity also issues monthly and quarterly Wealth Management M&A Transaction Reports summarizing M&A activity among RIAs and independent broker-dealers.
About Fidelity Investments
Fidelity’s mission is to strengthen the financial well-being of our customers and deliver better outcomes for the clients and businesses we serve. With assets under administration of $11.1 trillion, including discretionary assets of $4.2 trillion as of March 31, 2023, we focus on meeting the unique needs of a diverse set of customers. Privately held for over 75 years, Fidelity employs over 70,000 associates who are focused on the long-term success of our customers. For more information about Fidelity Investments, visit https://www.fidelity.com/about-fidelity/our-company.
Information provided in, and presentation of, this document are for informational and educational purposes only and are not a recommendation to take any particular action, or any action at all, nor an offer or solicitation to buy or sell any securities or services presented. It is not investment advice. Fidelity does not provide legal or tax advice.
Before making any investment decisions, you should consult with your own professional advisers and take into account all of the particular facts and circumstances of your individual situation. Fidelity and its representatives may have a conflict of interest in the products or services mentioned in these materials because they have a financial interest in them, and receive compensation, directly or indirectly, in connection with the management, distribution, and/or servicing of these products or services, including Fidelity funds, certain third-party funds and products, and certain investment services.
Fidelity Investments® provides investment products through Fidelity Distributors Company LLC; clearing, custody, or other brokerage services through National Financial Services LLC or Fidelity Brokerage Services LLC, Members NYSE, SIPC.
1094185.1.0
© 2023 FMR LLC. All rights reserved.
i The M&A Valuation and Deal Structure Study is based on data from firms consisting of M&A Leaders Forum members and other clients identified as doing M&A who participated in an online survey conducted by Fidelity Investments. Twenty-six RIAs and 4 COI (Center of Influence) firms participated in the survey. The study was fielded from February 13 through March 28, 2023, and covered M&A deals between January 2020 and March 2023. The 2019 study covered M&A deals between January 2017 and July 2019. Twenty-three firms participated in the study. Throughout the report, the approximate median has been calculated using the mid-point of the range where the actual median falls.
View source version on businesswire.com: https://www.businesswire.com/news/home/20230627945915/en/
Contacts
Contact for Media Only:
Corporate Communications
fidelitymediarelations@fmr.com
Veronique Caumeil
(202) 378-5615
Veronique.caumeil@fmr.com
Follow us on Twitter @FidelityNews
Visit About Fidelity and our online newsroom
Subscribe to emailed news from Fidelity