NORTH BILLERICA, MA / ACCESS Newswire / November 11, 2026 / Tecogen Inc. (NYSE American:TGEN), a leading manufacturer of clean energy products, reported revenues of $7.87 million and net loss of $1.59 million for the three months ended September 30, 2026 compared to revenues of $7.18 million, and a net loss of $2.13 million in 2025. For the nine months ended September 30, 2026, revenues were $19.96 million, and the net loss was $5.86 million, compared to revenues of $21.76 million, and a net loss of $4.25 million in 2025. Our cash and cash equivalents balance was $5.33 million at September 30, 2026.
Abinand Rangesh, CEO of Tecogen, commented, "Revenue increased substantially in the third quarter compared to the first two quarters this year as well as Q3 2025. The higher revenue and customer deposits means that our current cash position has increased to $5.7m today with a further $800k expected to be collected in the next two weeks. Compared to the same period last year, gross profit margin also increased by 7 percentage points showing that operational improvements are starting to take effect.
In addition, the backlog is presently more than $8m. The increases in utility rates and power shortages is accelerating demand for our products, especially in large commercial, healthcare and industrial facilities. Over 70% of this backlog constitutes large property portfolio owners and energy services companies. Therefore, successful initial projects may open the door to significant additional business.
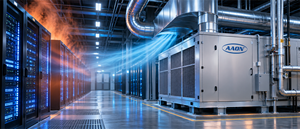
During the call, I will shed more light on the status of the data center pipeline and the pathway to closing them. I will also update shareholders on an exciting innovation we have developed that allows customers to use our dual power source technology as a retrofit to existing chillers, dry coolers, and other loads in data centers or other types of facilities. This innovation allows us to scale up production quickly while increasing margins. It is also timely given potential new data center construction moratoriums as it allows a data center to maximize power on already approved sites."
Key Takeaways
Net Loss and Earnings Per Share
- The net loss for the three months ended September 30, 2026 was $1.59 million compared to a net loss of $2.13 million for the same period of 2025, a decrease in the net loss of $0.54 million, due to increased Services segment revenue and gross profit, offset partially by an increase in operating expenses. EPS for the quarters ended September 30, 2026 and 2025 was a loss of $0.05/share and $0.07, respectively.
- The net loss for the nine months ended September 30, 2026 was $5.86 million compared to a net loss of $4.25 million for the same period of 2025, an increase in the net loss of $1.61 million, due to decreased revenue and gross profit from our Products segment and an increase in operating expenses. EPS for the nine months ended September 30, 2026 and 2025 was a loss of $0.20/share and $0.16/share, respectively.
Loss from Operations
- Loss from operations for the three months ended September 30, 2026 was $1.57 million compared to a loss from operations of $2.10 million for the same period in 2025, a decrease of $0.53 million, due to increased revenue and gross profit from our Services segment, offset partially an increase in operating expenses.
- Loss from operations for the nine months ended September 30, 2026 was $5.85 million compared to a loss from operations of $4.11 million for the same period in 2025, an increase of $1.74 million, due to decreased revenue and gross profit from our Products segment and an increase in operating expenses.
Revenues
- Revenues for the three months ended September 30, 2026 were $7.87 million compared to $7.18 million for the same period in 2025, a 9.6% increase.
- Products revenues in the three months ended September 30, 2026 were $3.05 million compared to $2.98 million for the same period in 2025, an increase of 2.2%. The increase in revenue during the quarter ended September 30, 2026 is due to increased chiller revenue, offset partially by decreased cogeneration and engineered accessories revenue.
- Services revenues in the three months ended September 30, 2026 were $4.46 million, compared to $3.94 million for the same period in 2025, an increase of 13.2% due to increased revenues from the acquired Aegis maintenance contracts and increased revenues from existing service contracts.
- Energy Production revenues in the three months ended September 30, 2026 were $0.36 million compared to $0.26 million for the same period in 2025, an increase of 42.0%. The increase in Energy Production revenue is due to improved site operations in the three months ended September 30, 2026.
- Revenues for the nine months ended September 30, 2026 were $19.96 million compared to $21.76 million for the same period in 2025, an 8.3% decrease.
- Products revenues in the nine months ended September 30, 2026 were $5.36 million compared to $8.67 million for the same period in 2025, a decrease of 38.2%. The decrease in revenue during the nine months ended September 30, 2026 is due to decreases in chiller, cogeneration and engineered accessories revenue.
- Services revenues in the nine months ended September 30, 2026 were $13.47 million, compared to $12.15 million for the same period in 2025, an increase of 10.9% due to increased revenues from existing contracts and increased revenues from the acquired Aegis maintenance contracts.
- Energy Production revenues in the nine months ended September 30, 2026 were $1.12 million compared to $0.93 million for the same period in 2025, an increase of 20.9%. The increase in Energy Production revenue is due to improved site operations in the nine months ended September 30, 2026.
Gross Profit
- Gross profit for the three months ended September 30, 2026 increased to $2.95 million compared to $2.18 million in the same period in 2025 due to increased Services revenues and lower costs. Gross margin increased to 37.4% in the three months ended September 30, 2026 compared to 30.4% for the same period in 2025. The increase is due to higher Services segment margin in the three months ended September 30, 2026.
- Gross profit for the nine months ended September 30, 2026 decreased to $7.71 million compared to $7.87 million in the same period in 2025 due to lower Products revenue. Gross margin increased to 38.6% in the nine months ended September 30, 2026 compared to 36.2% for the same period in 2025. The increase in gross margin was due to higher Services segment margin in the nine months ended September 30, 2026.
Operating Expenses
- Operating expenses increased $0.23 million, or 5.3%, to $4.51 million in the three months ended September 30, 2026 compared to $4.28 million in the same period in 2025, due to increases in payroll, benefits, stock-based compensation, credit losses, and depreciation and amortization.
- Operating expenses increased $1.59 million, or 13.3%, to $13.56 million in the nine months ended September 30, 2026 compared to $11.97 million in the same period in 2025, due to increases in payroll, benefits, stock-based compensation, credit losses, and depreciation and amortization.
Adjusted EBITDA
Adjusted EBITDA was negative $1.01 million for the three months ended September 30, 2026 compared to negative $1.67 million for the three months ended September 30, 2025. For the nine months ended September 30, 2026, adjusted EBITDA was negative $4.37 million compared to negative $3.22 million for the nine months ended September 30, 2025. (Adjusted EBITDA is defined as net income or loss attributable to Tecogen, adjusted for interest, income taxes, depreciation and amortization, stock-based compensation expense, unrealized gain or loss on investment securities, goodwill impairment charges and other non-cash non-recurring charges or gains including abandonment of intangible assets and asset impairment. See the table following the Condensed Consolidated Statements of Operations for a reconciliation from net income (loss) to Adjusted EBITDA, as well as important disclosures about the Company's use of Adjusted EBITDA).
Conference Call Scheduled for November 12, 2026, at 9:30 am ET
Tecogen will host a conference call on November 12, 2026 to discuss the third quarter results beginning at 9:30 am eastern time. To listen to the call please dial (877) 407-7186 within the U.S. and Canada, or +1 (201) 689-8052 from other international locations. Participants should ask to be joined to the Tecogen Third Quarter conference call. Please begin dialing 10 minutes before the scheduled starting time. The earnings press release will be available on the Company website at www.Tecogen.com in the "News and Events" section under "About Us." The earnings conference call will be webcast live. To view the associated slides, register for and listen to the webcast, go to https://ir.tecogen.com/ir-calendar. Following the call, the recording will be archived for 14 days.
The earnings conference call will be recorded and available for playback one hour after the end of the call. To listen to the playback, dial (877) 660-6853 within the U.S. and Canada, or (201) 612-7415 from other international locations and use Conference Call ID#: 13752231.
About Tecogen
Tecogen Inc. designs, manufactures, sells, installs, and maintains high efficiency, ultra-clean, cogeneration products including engine-driven combined heat and power, air conditioning systems, and high-efficiency water heaters for residential, commercial, recreational and industrial use. The company provides cost effective, environmentally friendly and reliable products for energy production that nearly eliminate criteria pollutants and significantly reduce a customer's carbon footprint. In business for over 35 years, Tecogen has shipped more than 3,200 units, supported by an established network of engineering, sales, and service personnel in key markets in North America. For more information, please visit www.tecogen.com or contact us for a free Site Assessment.
Forward Looking Statements
This press release contains "forward-looking statements" which may describe strategies, goals, outlooks or other non-historical matters, or projected revenues, income, returns or other financial measures, that may include words such as "believe," "expect," "anticipate," "intend," "plan," "estimate," "project," "target," "potential," "will," "should," "could," "likely," or "may" and similar expressions intended to identify forward-looking statements. These statements are only predictions and involve known and unknown risks, uncertainties, and other factors that may cause our actual results to differ materially from those expressed or implied by such forward-looking statements. Given these uncertainties, you should not place undue reliance on these forward-looking statements. Forward-looking statements speak only as of the date on which they are made, and we undertake no obligation to update or revise any forward-looking statements except as required under the securities laws.
In addition to those factors described in our Annual Report on Form 10-K, our Quarterly Reports on Form 10-Q and in our Current reports on Form 8-K, under "Risk Factors," and elsewhere therein, among the factors that could cause actual results to differ materially from past and projected future results are the following: fluctuations in demand for our products and services, competing technological developments, issues relating to research and development, the availability of incentives, rebates, and tax benefits relating to our products and services, changes in the regulatory environment relating to our products and services, integration of acquired business operations, the impact of tariffs, and the ability to obtain financing on favorable terms to fund existing operations and anticipated growth.
In addition to GAAP financial measures, this press release includes certain non-GAAP financial measures, including adjusted EBITDA which excludes certain expenses as described in the presentation. We use Adjusted EBITDA as an internal measure of business operating performance and believe that the presentation of non-GAAP financial measures provides a meaningful perspective of the underlying operating performance of our current business and enables investors to better understand and evaluate our historical and prospective operating performance by eliminating items that vary from period to period without correlation to our core operating performance and highlights trends in our business that may not otherwise be apparent when relying solely on GAAP financial measures.
Tecogen Media & Investor Relations Contact Information:
Abinand Rangesh
P: 781-466-6487
E: Abinand.Rangesh@tecogen.com
TECOGEN INC.
CONDENSED CONSOLIDATED BALANCE SHEETS
(unaudited)
| September 30, 2026 | December 31, 2025 | |||||||
ASSETS |
||||||||
Current assets: |
||||||||
Cash and cash equivalents |
$ | 5,333,436 | $ | 12,430,287 | ||||
Accounts receivable, net of allowances for expected credit losses of $563,952 and $389,079, respectively |
5,181,659 | 4,280,991 | ||||||
Unbilled revenue |
138,020 | 138,020 | ||||||
Inventories, net |
11,486,060 | 10,949,697 | ||||||
Prepaid and other current assets |
876,832 | 1,086,310 | ||||||
Total current assets |
23,016,007 | 28,885,305 | ||||||
Long-term assets: |
||||||||
Property, plant and equipment, net |
1,469,871 | 1,609,321 | ||||||
Right-of-use assets - operating leases, net |
1,263,405 | 1,490,094 | ||||||
Right-of-use assets - finance leases, net |
1,407,078 | 1,434,080 | ||||||
Intangible assets, net |
1,879,409 | 2,146,503 | ||||||
Goodwill |
1,248,442 | 1,248,442 | ||||||
Other assets |
82,080 | 176,358 | ||||||
TOTAL ASSETS |
$ | 30,366,292 | $ | 36,990,103 | ||||
LIABILITIES AND STOCKHOLDERS' EQUITY |
||||||||
Current liabilities: |
||||||||
Accounts payable |
$ | 3,109,047 | $ | 3,381,545 | ||||
Accrued liabilities |
2,606,828 | 2,814,150 | ||||||
Deferred revenue, current portion |
1,328,096 | 1,530,977 | ||||||
Operating lease obligations, current portion |
488,460 | 538,641 | ||||||
Finance lease obligations, current portion |
340,820 | 280,265 | ||||||
Acquisition liabilities, current portion |
635,016 | 677,162 | ||||||
Unfavorable contract liability, current portion |
39,357 | 44,433 | ||||||
Total current liabilities |
8,547,624 | 9,267,173 | ||||||
Long-term liabilities: |
||||||||
Deferred revenue, net of current portion |
3,118,340 | 3,265,886 | ||||||
Operating lease obligations, net of current portion |
834,732 | 1,004,488 | ||||||
Finance lease obligations, net of current portion |
900,082 | 992,285 | ||||||
Acquisition liabilities, net of current portion |
568,820 | 826,757 | ||||||
Unfavorable contract liability, net of current portion |
131,806 | 160,902 | ||||||
Total liabilities |
14,101,404 | 15,517,491 | ||||||
Commitments and contingencies |
||||||||
Stockholders' equity: |
||||||||
Tecogen Inc. stockholders' equity: |
||||||||
Common stock, $0.001 par value; 100,000,000 shares authorized; 30,187,822 issued and outstanding at September 30, 2026 and 29,846,479 shares issued and outstanding at December 31, 2025 |
30,189 | 29,847 | ||||||
Additional paid-in capital |
79,947,620 | 78,216,467 | ||||||
Unearned compensation |
(1,822,840 | ) | (712,019 | ) | ||||
Accumulated deficit |
(61,747,393 | ) | (55,888,649 | ) | ||||
Total Tecogen Inc. stockholders' equity |
16,407,576 | 21,645,646 | ||||||
Noncontrolling interest |
(142,688 | ) | (173,034 | ) | ||||
Total stockholders' equity |
16,264,888 | 21,472,612 | ||||||
TOTAL LIABILITIES AND STOCKHOLDERS' EQUITY |
$ | 30,366,292 | $ | 36,990,103 | ||||
TECOGEN INC.
CONDENSED CONSOLIDATED STATEMENTS OF OPERATIONS
(unaudited)
| Three Months Ended | ||||||||
| September 30, 2026 | September 30, 2025 | |||||||
Revenues |
||||||||
Products |
$ | 3,047,954 | $ | 2,983,795 | ||||
Services |
4,462,607 | 3,943,510 | ||||||
Energy production |
363,259 | 255,816 | ||||||
Total revenues |
7,873,820 | 7,183,121 | ||||||
Cost of sales |
||||||||
Products |
2,221,685 | 1,885,377 | ||||||
Services |
2,561,731 | 2,946,438 | ||||||
Energy production |
144,459 | 167,740 | ||||||
Total cost of sales |
4,927,875 | 4,999,555 | ||||||
Gross profit |
2,945,945 | 2,183,566 | ||||||
Operating expenses: |
||||||||
General and administrative |
3,724,299 | 3,411,762 | ||||||
Selling |
508,669 | 572,869 | ||||||
Research and development |
285,450 | 297,926 | ||||||
(Gain) loss on disposition of assets |
(6,075 | ) | 1,713 | |||||
Total operating expenses |
4,512,343 | 4,284,270 | ||||||
Loss from operations |
(1,566,398 | ) | (2,100,704 | ) | ||||
Other income (expense) |
||||||||
Other income (expense), net |
37,481 | 81,925 | ||||||
Interest expense |
(37,408 | ) | (41,113 | ) | ||||
Unrealized gain (loss) on investment securities |
- | (56,246 | ) | |||||
Total other income (expense), net |
73 | (15,434 | ) | |||||
Loss before provision for state income taxes |
(1,566,325 | ) | (2,116,138 | ) | ||||
Provision for state income taxes |
- | 2,928 | ||||||
Consolidated net loss |
(1,566,325 | ) | (2,119,066 | ) | ||||
(Income) loss attributable to the noncontrolling interest |
(23,243 | ) | (11,881 | ) | ||||
Loss attributable to Tecogen Inc. |
$ | (1,589,568 | ) | $ | (2,130,947 | ) | ||
Net loss per share - basic |
$ | (0.05 | ) | $ | (0.07 | ) | ||
Weighted average shares outstanding - basic |
30,185,254 | 28,817,040 | ||||||
Net loss per share - diluted |
$ | (0.05 | ) | $ | (0.07 | ) | ||
Weighted average shares outstanding - diluted |
30,185,254 | 28,817,040 | ||||||
| Three Months Ended | ||||||||
| September 30, 2026 | September 30, 2025 | |||||||
Non-GAAP financial disclosure (1) |
||||||||
Net loss attributable to Tecogen Inc. |
$ | (1,589,568 | ) | $ | (2,130,947 | ) | ||
Interest expense, net |
37,408 | 41,113 | ||||||
Income taxes |
- | 2,928 | ||||||
Depreciation & amortization, net |
276,542 | 230,149 | ||||||
EBITDA |
(1,275,618 | ) | (1,856,757 | ) | ||||
Stock based compensation |
268,330 | 126,419 | ||||||
Unrealized gain on investment securities |
- | 56,246 | ||||||
Adjusted EBITDA |
$ | (1,007,288 | ) | $ | (1,674,092 | ) | ||
TECOGEN INC.
CONDENSED CONSOLIDATED STATEMENTS OF OPERATIONS
(unaudited)
| Nine Months Ended | ||||||||
| September 30, 2026 | September 30, 2025 | |||||||
Revenues |
||||||||
Products |
$ | 5,358,026 | $ | 8,672,927 | ||||
Services |
13,474,254 | 12,153,700 | ||||||
Energy production |
1,123,445 | 929,085 | ||||||
Total revenues |
19,955,725 | 21,755,712 | ||||||
Cost of sales |
||||||||
Products |
3,453,788 | 5,605,282 | ||||||
Services |
8,034,469 | 7,675,073 | ||||||
Energy production |
757,959 | 608,258 | ||||||
Total cost of sales |
12,246,216 | 13,888,613 | ||||||
Gross profit |
7,709,509 | 7,867,099 | ||||||
Operating expenses: |
||||||||
General and administrative |
10,953,622 | 9,431,073 | ||||||
Selling |
1,639,642 | 1,682,085 | ||||||
Research and development |
969,497 | 859,318 | ||||||
(Gain) loss on disposition of assets |
(781 | ) | 1,433 | |||||
Goodwill impairment |
- | - | ||||||
Total operating expenses |
13,561,980 | 11,973,909 | ||||||
Loss from operations |
(5,852,471 | ) | (4,106,810 | ) | ||||
Other income (expense) |
||||||||
Other income (expense), net |
146,231 | 61,302 | ||||||
Interest expense |
(110,897 | ) | (111,592 | ) | ||||
Unrealized loss on investment securities |
- | (74,995 | ) | |||||
Total other income (expense), net |
35,334 | (125,285 | ) | |||||
Loss before provision for state income taxes |
(5,817,137 | ) | (4,232,095 | ) | ||||
Provision for state income taxes |
11,261 | 20,615 | ||||||
Consolidated net loss |
(5,828,398 | ) | (4,252,710 | ) | ||||
(Income) loss attributable to noncontrolling interest |
(30,346 | ) | (2,264 | ) | ||||
Net loss attributable to Tecogen Inc. |
$ | (5,858,744 | ) | $ | (4,254,974 | ) | ||
Net loss per share - basic |
$ | (0.20 | ) | $ | (0.16 | ) | ||
Weighted average shares outstanding - basic |
30,016,277 | 26,354,875 | ||||||
Net loss per share - diluted |
$ | (0.20 | ) | $ | (0.16 | ) | ||
Weighted average shares outstanding - diluted |
30,016,277 | 26,354,875 | ||||||
| Nine Months Ended | ||||||||
| September 30, 2026 | September 30, 2025 | |||||||
Non-GAAP financial disclosure (1) |
||||||||
Net loss attributable to Tecogen Inc. |
$ | (5,858,744 | ) | $ | (4,254,974 | ) | ||
Interest expense, net |
110,897 | 111,592 | ||||||
Income taxes |
11,261 | 20,615 | ||||||
Depreciation & amortization, net |
820,391 | 621,530 | ||||||
EBITDA |
(4,916,195 | ) | (3,501,237 | ) | ||||
Stock based compensation |
545,711 | 209,858 | ||||||
Unrealized (gain) loss on marketable securities |
- | 74,995 | ||||||
Adjusted EBITDA |
$ | (4,370,484 | ) | $ | (3,216,384 | ) | ||
(1) Non-GAAP Financial Measures
In addition to reporting net income, a U.S. generally accepted accounting principle ("GAAP") measure, this news release contains information about Adjusted EBITDA (net income (loss) attributable to Tecogen Inc adjusted for interest, income taxes, depreciation and amortization, stock-based compensation expense, unrealized gain or loss on investment securities, goodwill impairment charges and other non-cash non-recurring charges including abandonment of certain intangible assets), which is a non-GAAP measure. The Company believes Adjusted EBITDA allows investors to view its performance in a manner similar to the methods used by management and provides additional insight into its operating results. Adjusted EBITDA is not calculated through the application of GAAP. Accordingly, it should not be considered as a substitute for the GAAP measure of net income and, therefore, should not be used in isolation of, but in conjunction with, the GAAP measure. The use of any non-GAAP measure may produce results that vary from the GAAP measure and may not be comparable to a similarly defined non-GAAP measure used by other companies.
TECOGEN INC.
CONDENSED CONSOLIDATED STATEMENTS OF CASH FLOWS
(unaudited)
| Nine Months Ended | ||||||||
| September 30, 2026 | September 30, 2025 | |||||||
CASH FLOWS FROM OPERATING ACTIVITIES: |
||||||||
Consolidated net loss |
$ | (5,828,398 | ) | $ | (4,252,710 | ) | ||
Adjustments to reconcile net loss to net cash provided by (used in) operating activities: |
||||||||
Depreciation and amortization |
820,391 | 621,530 | ||||||
Provision for (recovery of) credit losses |
174,873 | (50,883 | ) | |||||
Stock-based compensation |
545,711 | 209,858 | ||||||
Unrealized loss on investment securities |
- | 74,995 | ||||||
Loss (gain) on disposition of assets |
(781 | ) | 1,433 | |||||
Non-cash interest expense |
- | 43,476 | ||||||
Changes in operating assets and liabilities |
||||||||
(Increase) decrease in: |
||||||||
Accounts receivable |
(1,075,540 | ) | (143,013 | ) | ||||
Inventory |
(536,365 | ) | 75,921 | |||||
Unbilled revenue |
- | 272,160 | ||||||
Prepaid assets and other current assets |
113,015 | (238,270 | ) | |||||
Other assets |
503,616 | 330,804 | ||||||
Increase (decrease) in: |
||||||||
Accounts payable |
(272,496 | ) | (725,386 | ) | ||||
Accrued expenses and other current liabilities |
(207,322 | ) | 96,898 | |||||
Deferred revenue |
(350,427 | ) | (2,984,276 | ) | ||||
Other liabilities |
(732,820 | ) | (668,956 | ) | ||||
Net cash provided by (used in) operating activities |
(6,846,543 | ) | (7,336,419 | ) | ||||
CASH FLOWS FROM INVESTING ACTIVITIES: |
||||||||
Purchases of property and equipment |
(149,454 | ) | (353,296 | ) | ||||
Proceeds from disposition of assets |
10,784 | 1,280 | ||||||
Proceeds from the liquidation of investment in Aivita Group |
96,464 | - | ||||||
Distributions to noncontrolling interest |
- | (42,956 | ) | |||||
Net cash used in investing activities |
(42,206 | ) | (394,972 | ) | ||||
CASH FLOWS FROM FINANCING ACTIVITIES: |
||||||||
Proceeds from follow on offering, net of transaction costs |
- | 18,105,100 | ||||||
Related-party note repayment |
- | (1,076,956 | ) | |||||
Finance lease principal payments |
(283,065 | ) | (106,414 | ) | ||||
Proceeds from exercise of stock options |
74,963 | 658,403 | ||||||
Net cash provided (used in) by financing activities |
(208,102 | ) | 17,580,133 | |||||
Net increase (decrease) in cash and cash equivalents |
(7,096,851 | ) | 9,848,742 | |||||
Cash and cash equivalents, beginning of the period |
12,430,287 | 5,405,233 | ||||||
Cash and cash equivalents, end of the period |
$ | 5,333,436 | $ | 15,253,975 | ||||
Supplemental disclosure of cash flow information: |
||||||||
Cash paid for interest |
$ | 109,652 | $ | 145,072 | ||||
Cash paid for taxes |
$ | 11,261 | $ | 20,615 | ||||
Non-cash investing activities |
||||||||
Right-of-use assets acquired under operating leases |
$ | 182,649 | $ | 193,480 | ||||
Right-of-use assets acquired under finance leases |
$ | 281,567 | $ | 1,013,564 | ||||
Non-cash financing activities |
||||||||
Related party note conversion to common stock |
$ | - | $ | 514,148 | ||||
SOURCE: Tecogen, Inc.
View the original press release on ACCESS Newswire