Despite a challenging industry environment, REV Group, Inc. (REVG) recorded consistent top-line growth in the last reported quarter, fuelled by higher net sales, including price realization across all sectors. The company presents a strong stance for further growth, positioning it as a potentially ideal investment.
“Within the quarter, several businesses in the F&E and Commercial segments improved their operational consistency with increased starts and completions resulting in improved net sales,” REV Group Inc. President and CEO Mark Skonieczny said.
Moreover, REVG also raised the full-year outlook for consolidated revenue and EBITDA. The company is expected to benefit from continued manufacturing and machinery usage recovery, driving demand.
The stock has garnered significant attention recently, as evident from the substantial price increase over the last few months. REVG’s shares have gained 30.2% over the past three months.
Following this positive trajectory, let us delve into some key metrics facilitating an insight into the company’s prospects.
Analysing REV Group Inc.’s Financial Trajectory: From Losses to Profits (2020-2023)
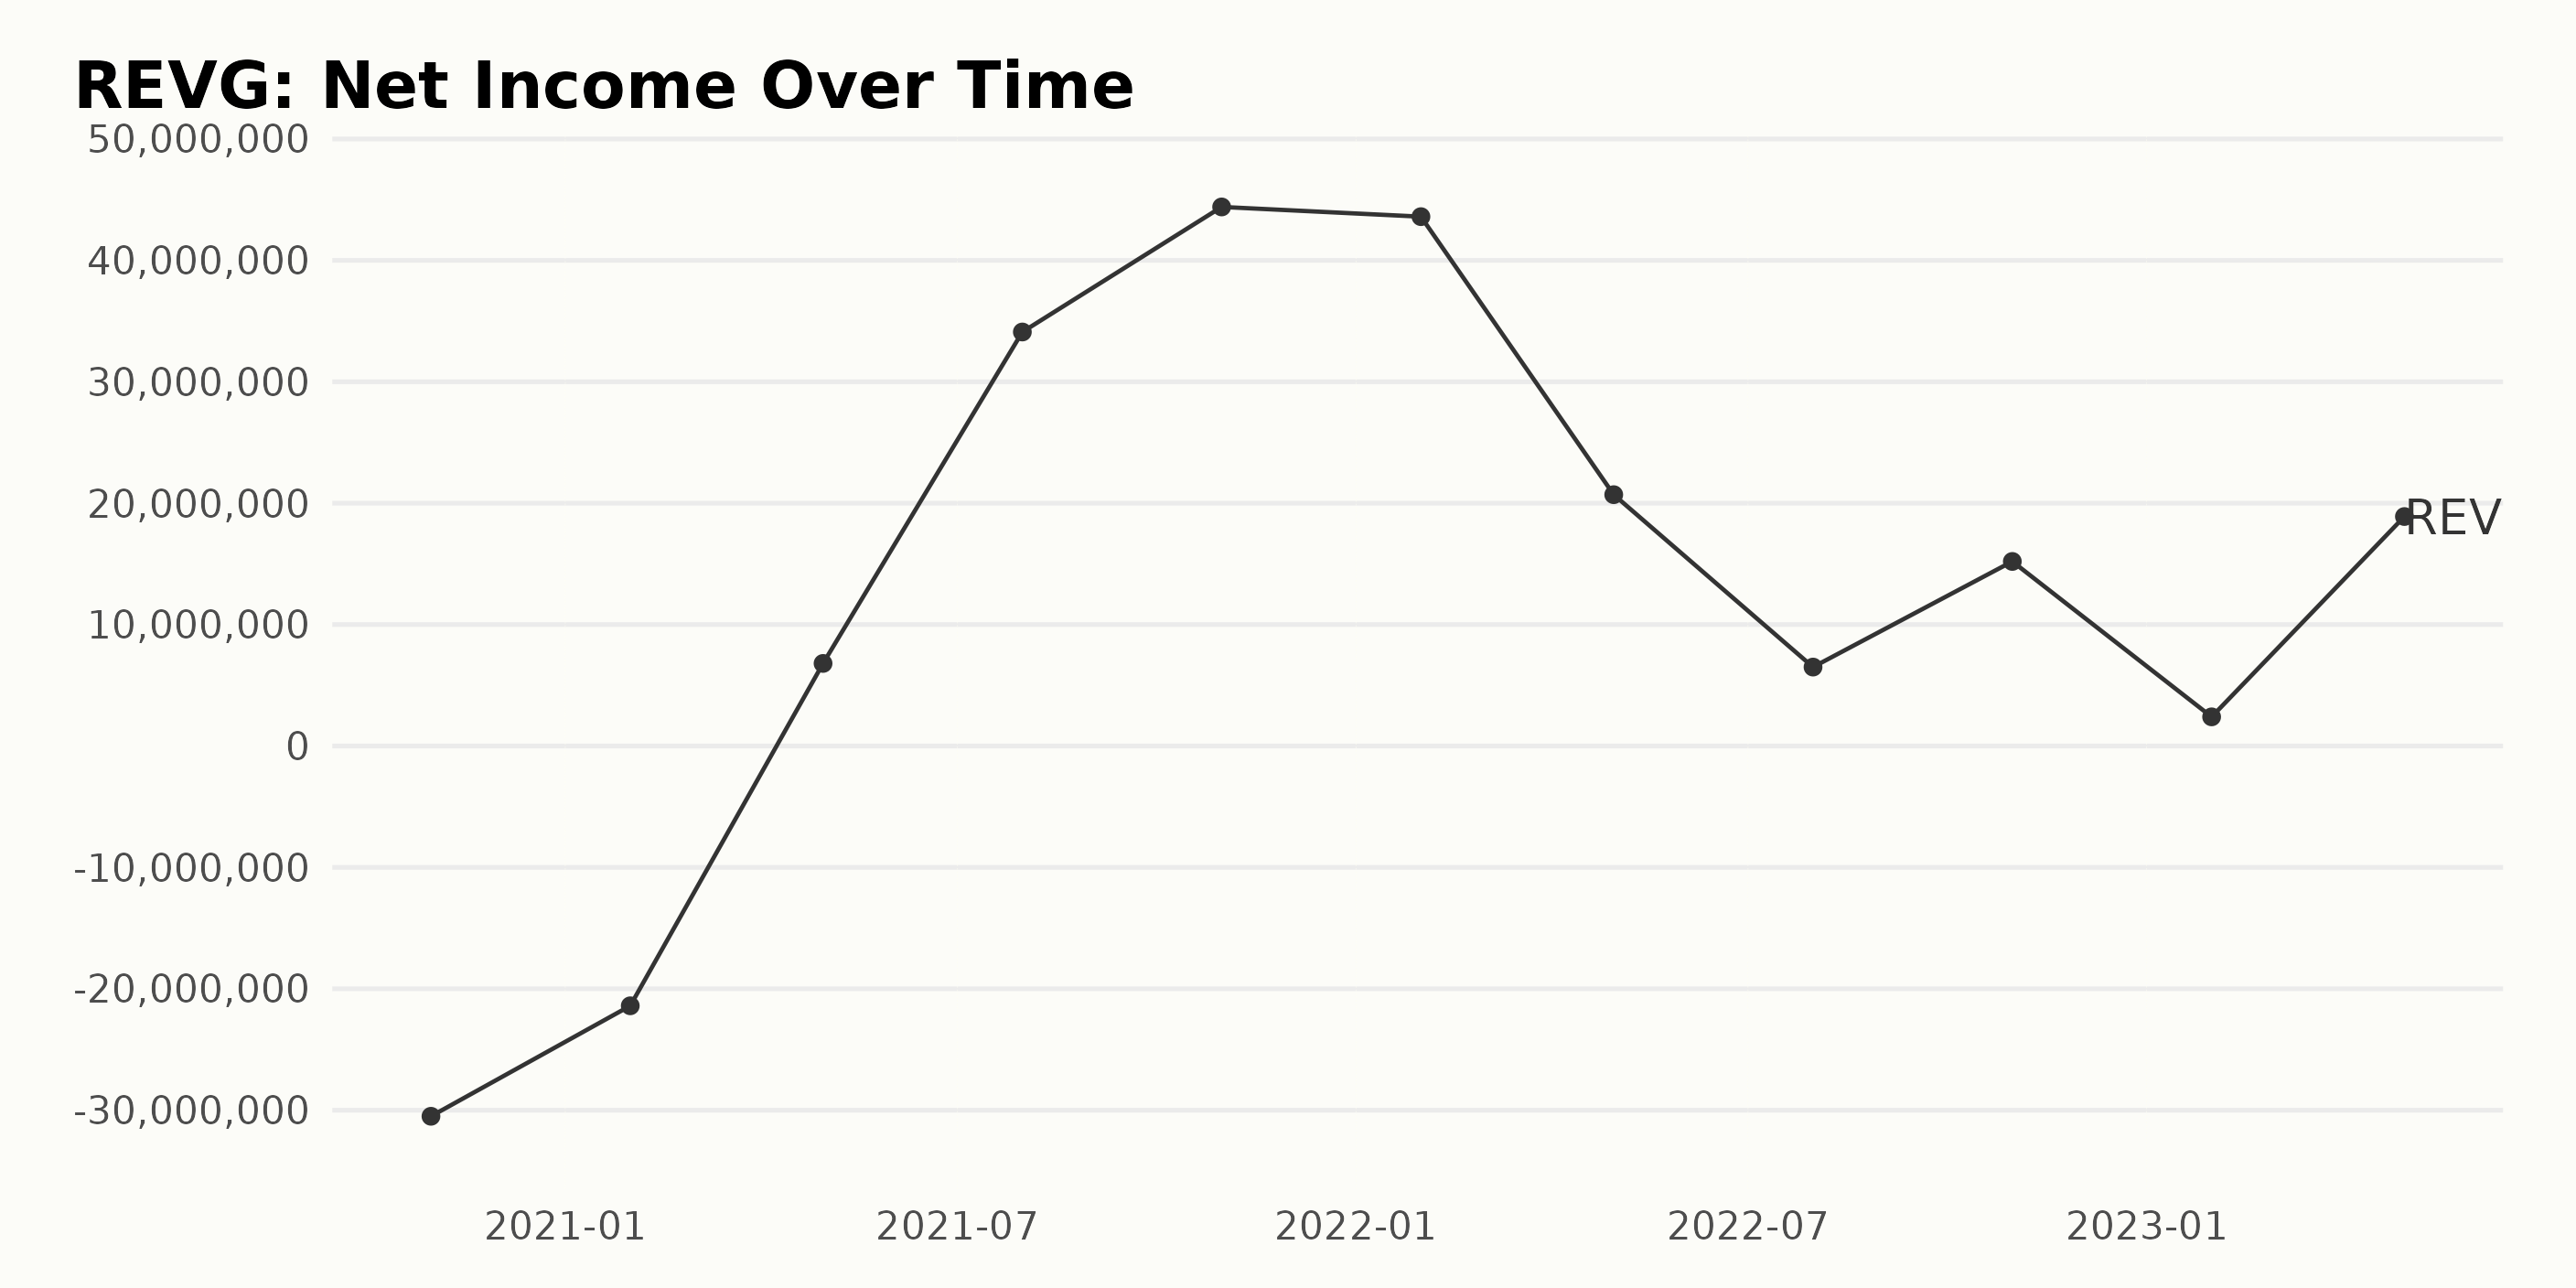
The trend and fluctuations of the trailing-12-month net income for REVG between October 2020 and April 2023 show a significant progression from losses to profits despite periodic dips.
- Net income improved from a loss of -$30.5 million in October 2020 to a deficit of -$21.4 million by January 2021.
- A notable turnaround occurred when REVG reported a net income of $6.8 million in April 2021, breaking the stream of losses observed since October 2020.
- By July 2021, the company’s fortunes vastly improved, with a net income of $34.1 million, which climbed further to peak at $44.4 million in October 2021.
- Since then, there has been some fluctuation, with a decrease to $43.6 million in January 2022, followed by a dip to $20.7 million in April 2022, and an even deeper slump to $6.5 million in July 2022.
- However, signs of recovery emerged with a bounce back to $15.2 million in October 2022.
- Despite a sharp dip to $2.4 million in January 2023, a gain was seen in April 2023, where the company reported a net income of $18.9 million.
Considering the initial value of -$30.5 million and the last observed value of $18.9 million, the net income has demonstrated a positive growth rate throughout the period. The emphasis on recent data suggests a generally upward trajectory, albeit with intermittent dips, indicating a volatile growth pattern.
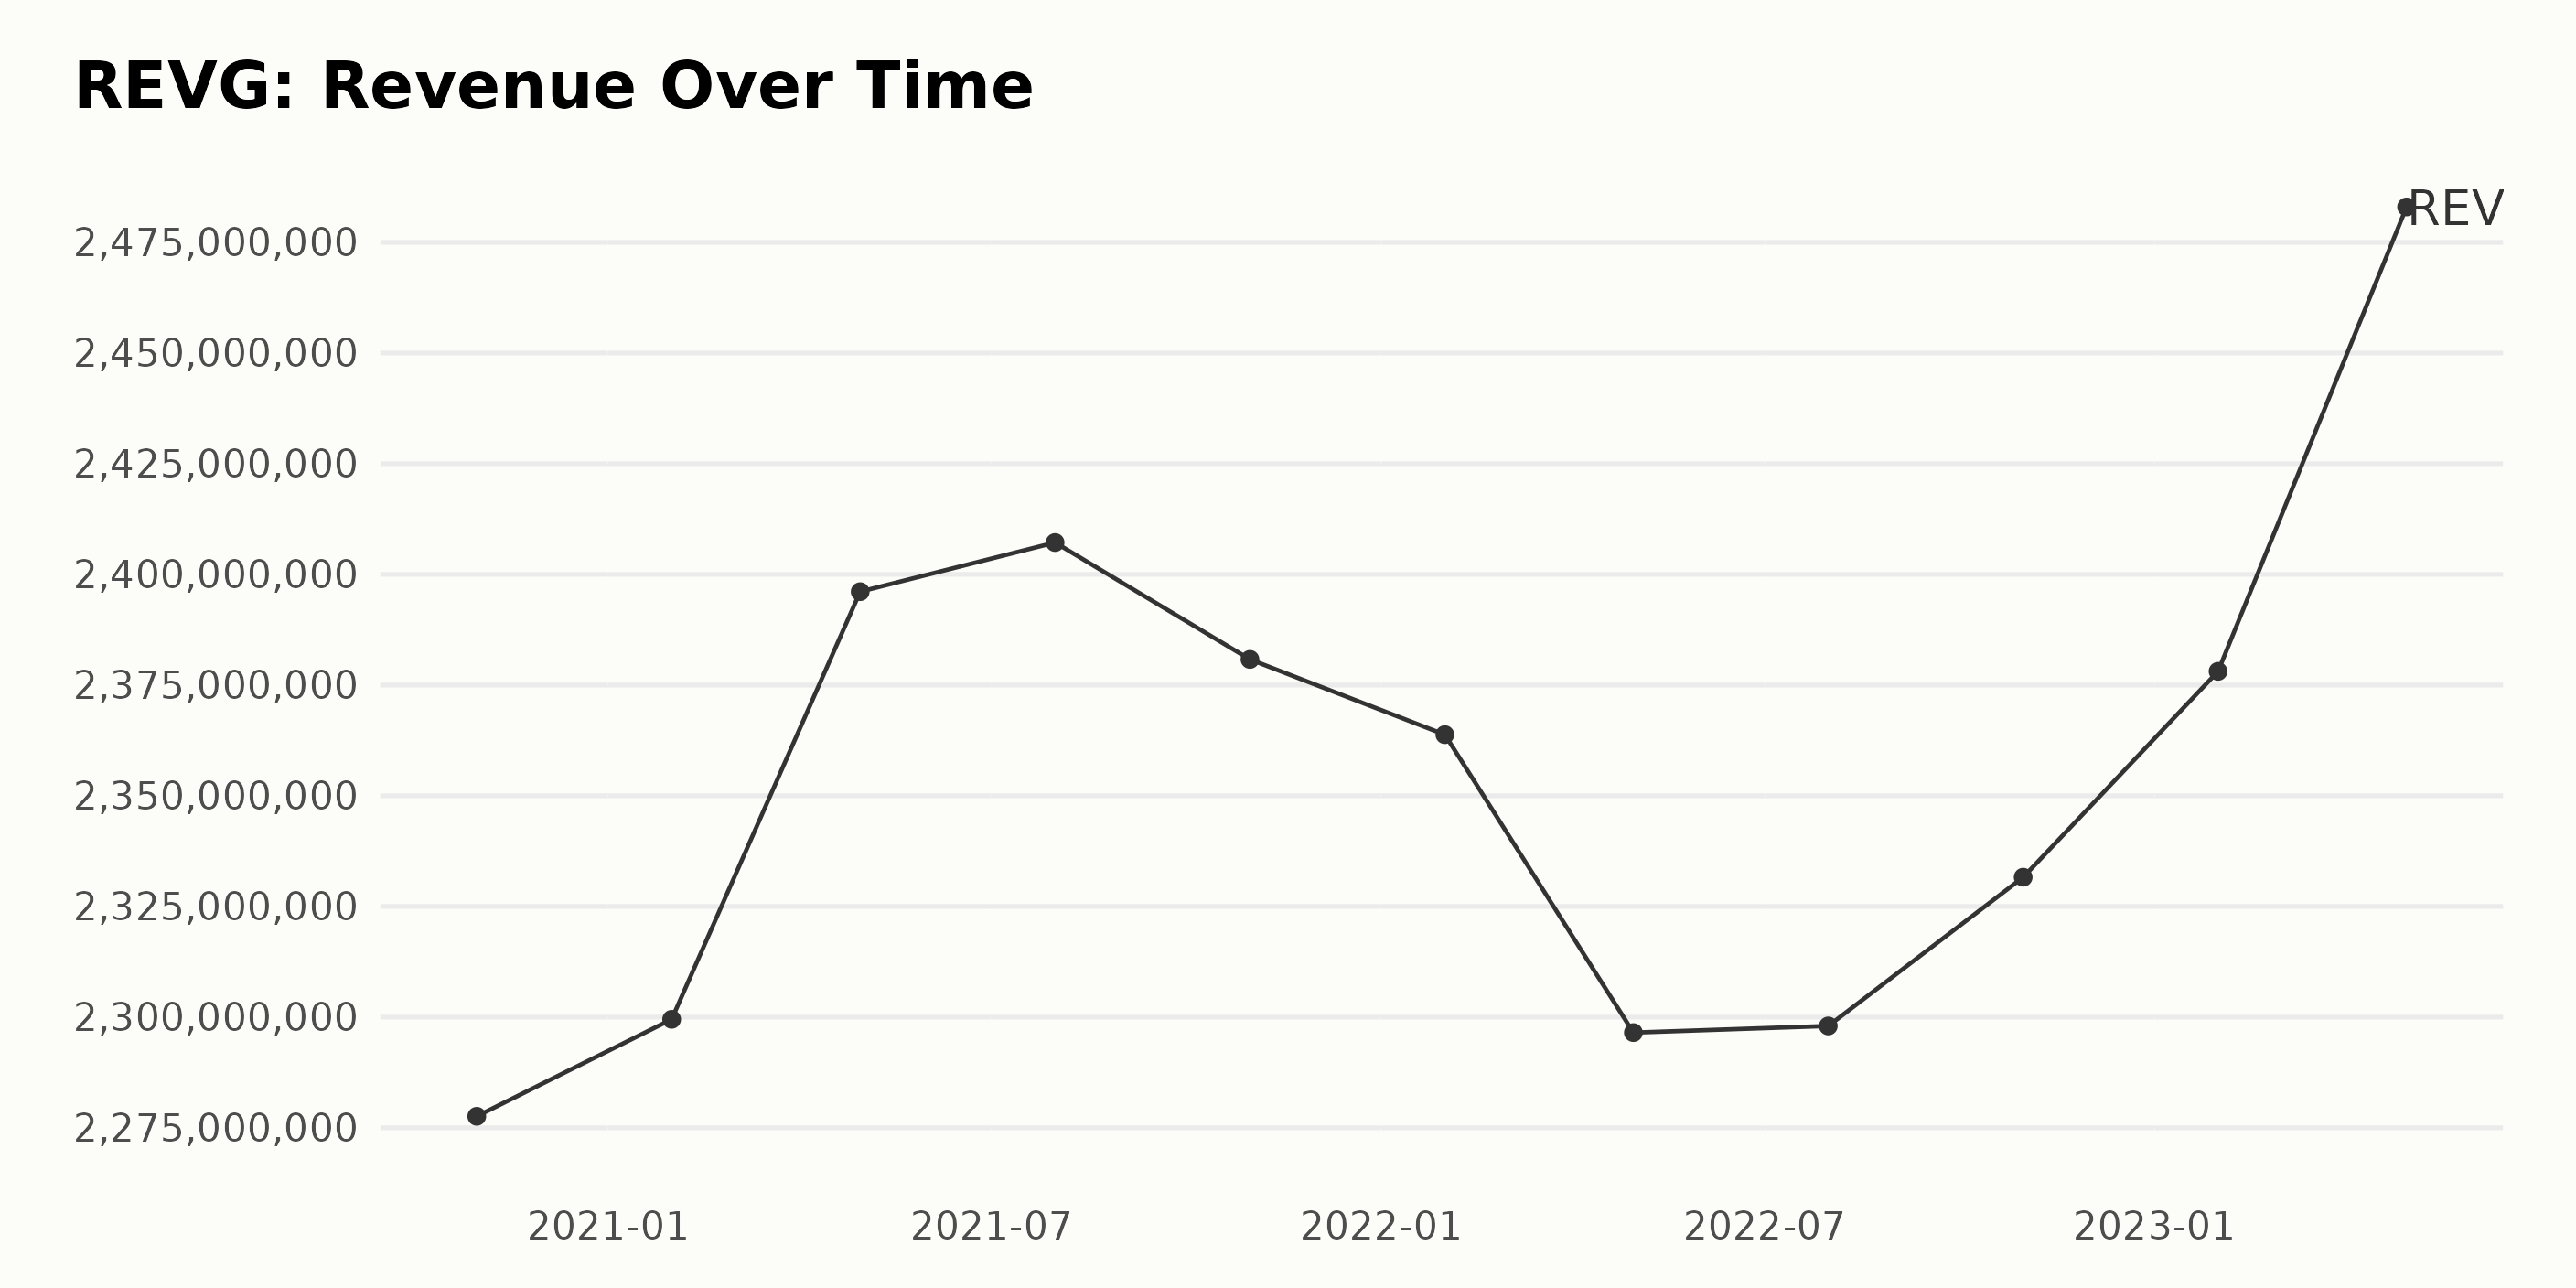
The series data reflects the fluctuating trailing-12-month revenue trends of REVG from October 2020 to April 2023. Notable points in the revenue trend are as below:
- The company’s revenue started at $2.28 billion in October 2020, with minor variations witnessed through the next quarter.
- Despite a steady initial growth, a slight dip was observed in January 2021 ($2.30 billion), picking up again in April 2021, reaching $2.40 billion in July 2021. This trend continued with a small decrease till October 2021 ($2.38 billion).
- January 2022 began with a lower yield ($2.36 billion), progressing towards a more considerable downturn by April 2022 ($2.30 billion).
- Barely recovering in July 2022 ($2.30 billion), there was a modest increase in October 2022 ($2.33 billion), which continued into the new year, January 2023 ($2.38 billion).
- The most recent data for April 2023 shows a substantial revenue spike at $2.48 billion, significantly higher than the previous months.
Calculating the growth rate from the first value in October 2020 ($2.28 billion) to the last in April 2023 ($2.48 billion), REVG experienced an approximate growth of 8.77% over this period.
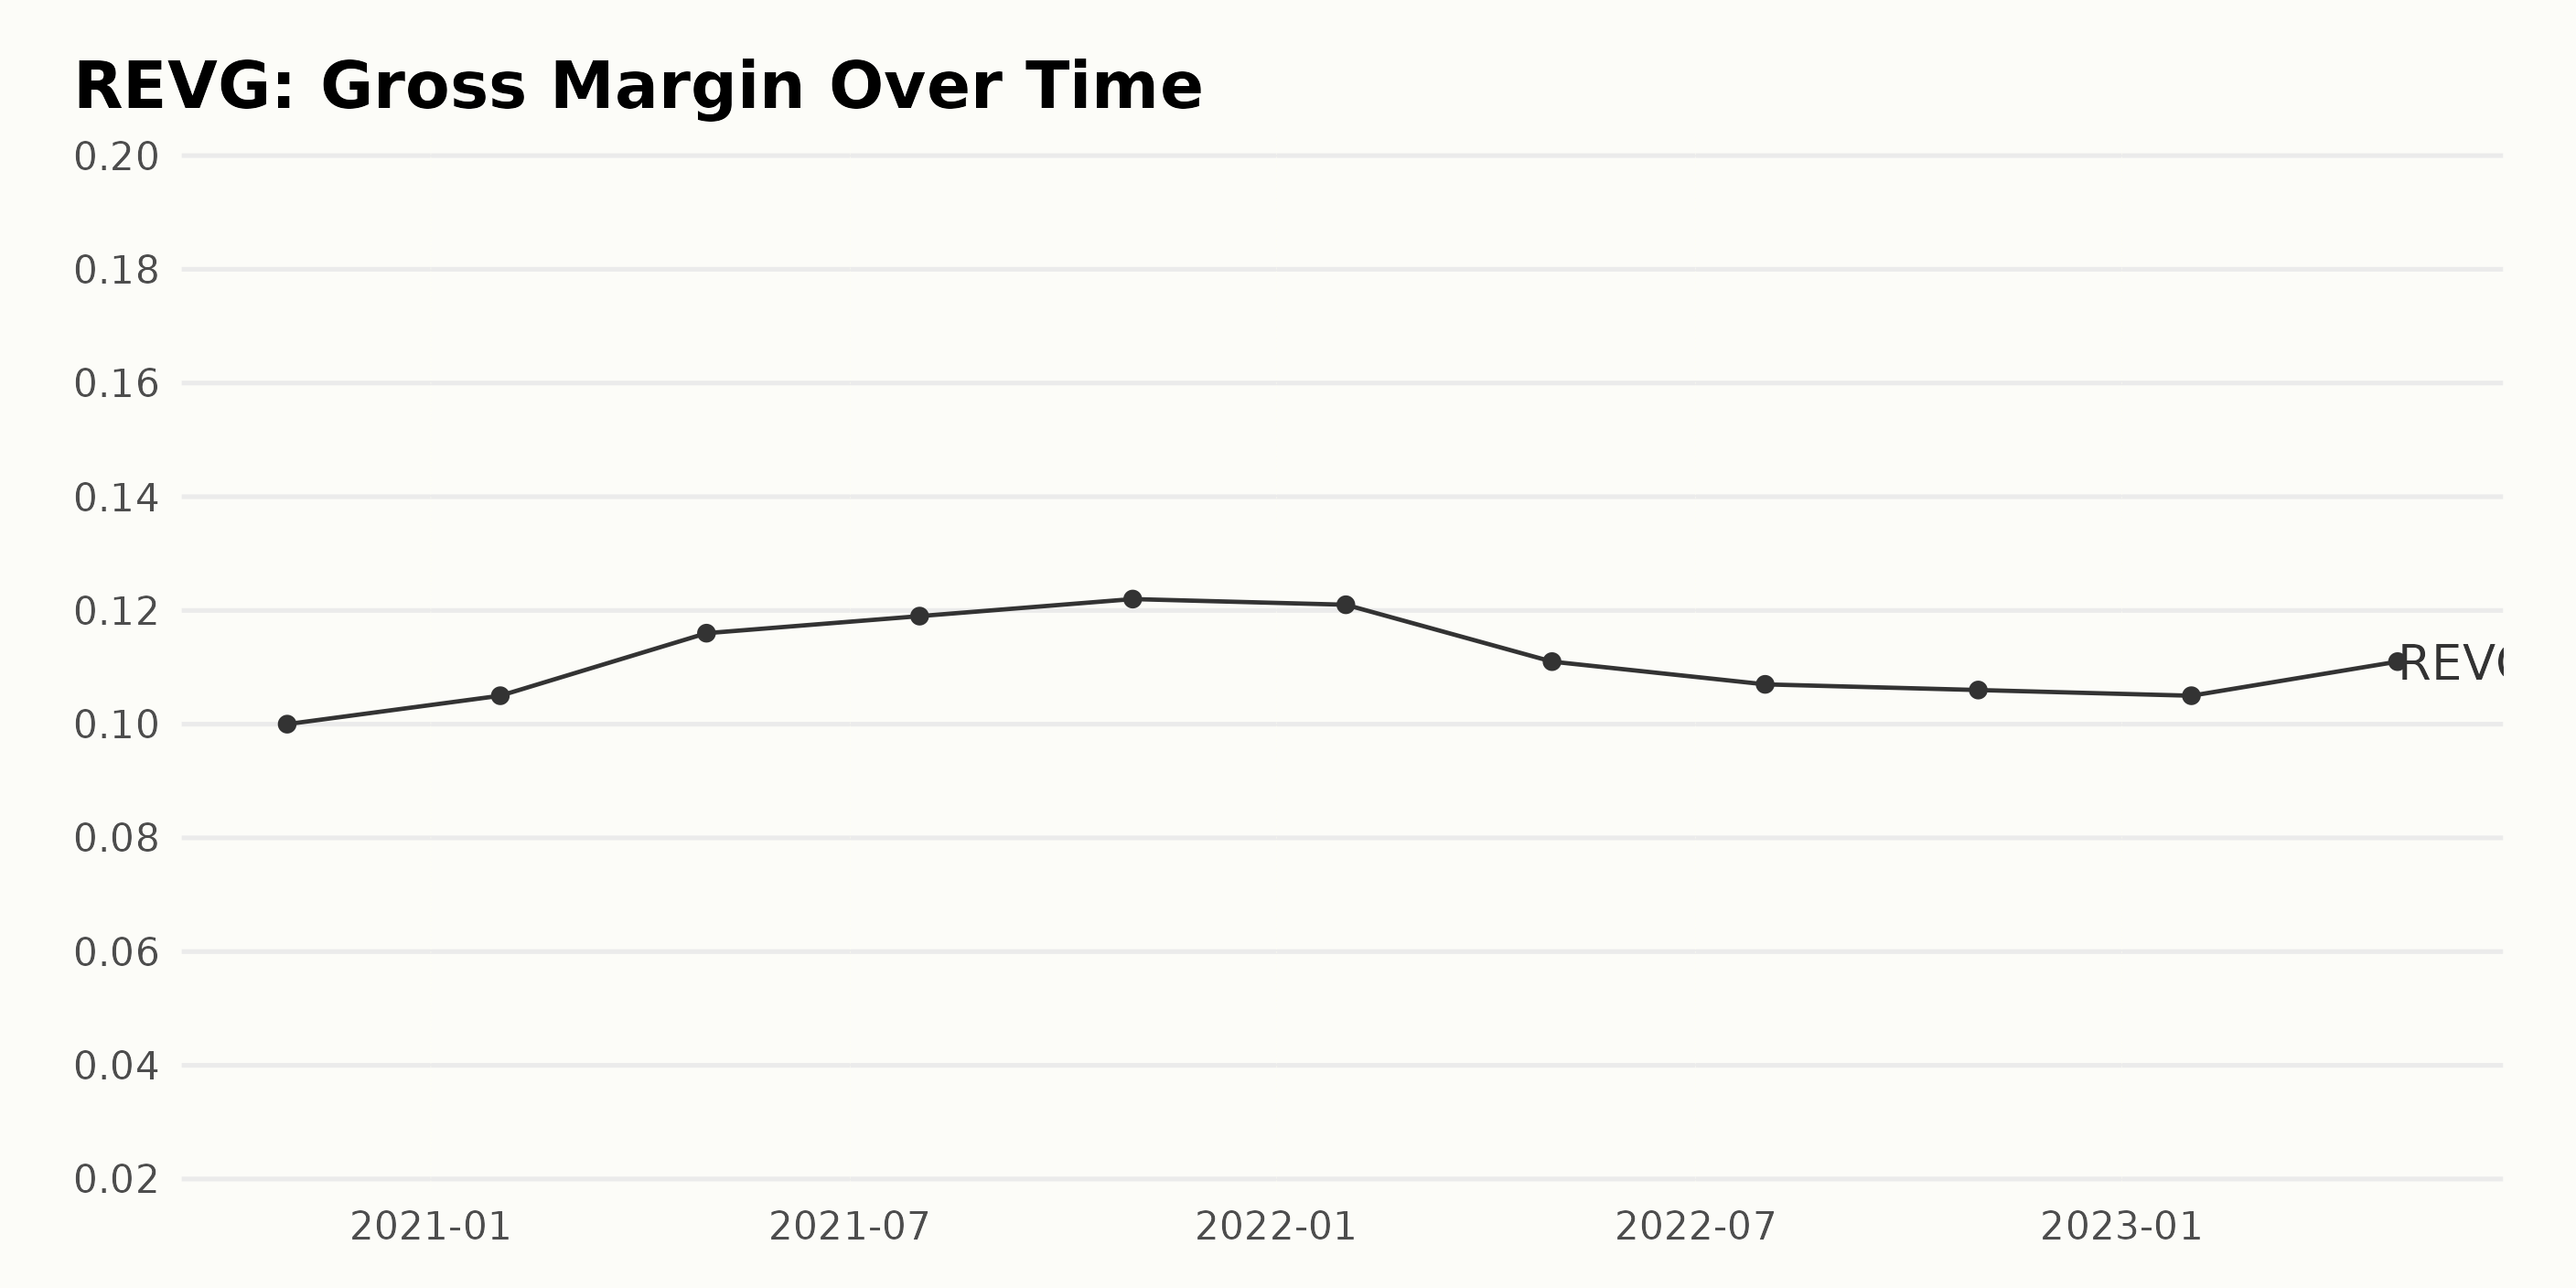
In the last three years, from October 2020 to April 2023, the Gross Margin of REVG has seen both rises and falls in percentage points. Here are the key data points noting the changes:
- The gross margin of REVG as of October 2020 stood at 10%.
- There was a minor increase in gross margin percent over the following three quarterly periods, reaching its peak at 11.9% in July 2021.
- This growth did not maintain its trajectory, with the gross margin declining gradually to 10.5% by January 2023.
- However, by April 2023, the gross margin saw a slight uptick, resting at 11.1%.
Over the total measured period, there was a net increase from the first value to the last, indicating a growth rate of approximately 1.1%. The larger fluctuations occurred primarily in the 2021-2022 fiscal year, while the most recent changes show a downward trend followed by a slight recovery. Lastly, it’s worth emphasizing the final reported value in April 2023, where the gross margin stands again at 11.1%. Thus, despite the variabilities, REVG’s gross margin has managed to stay above the initial value after some highs and lows throughout the observed period.
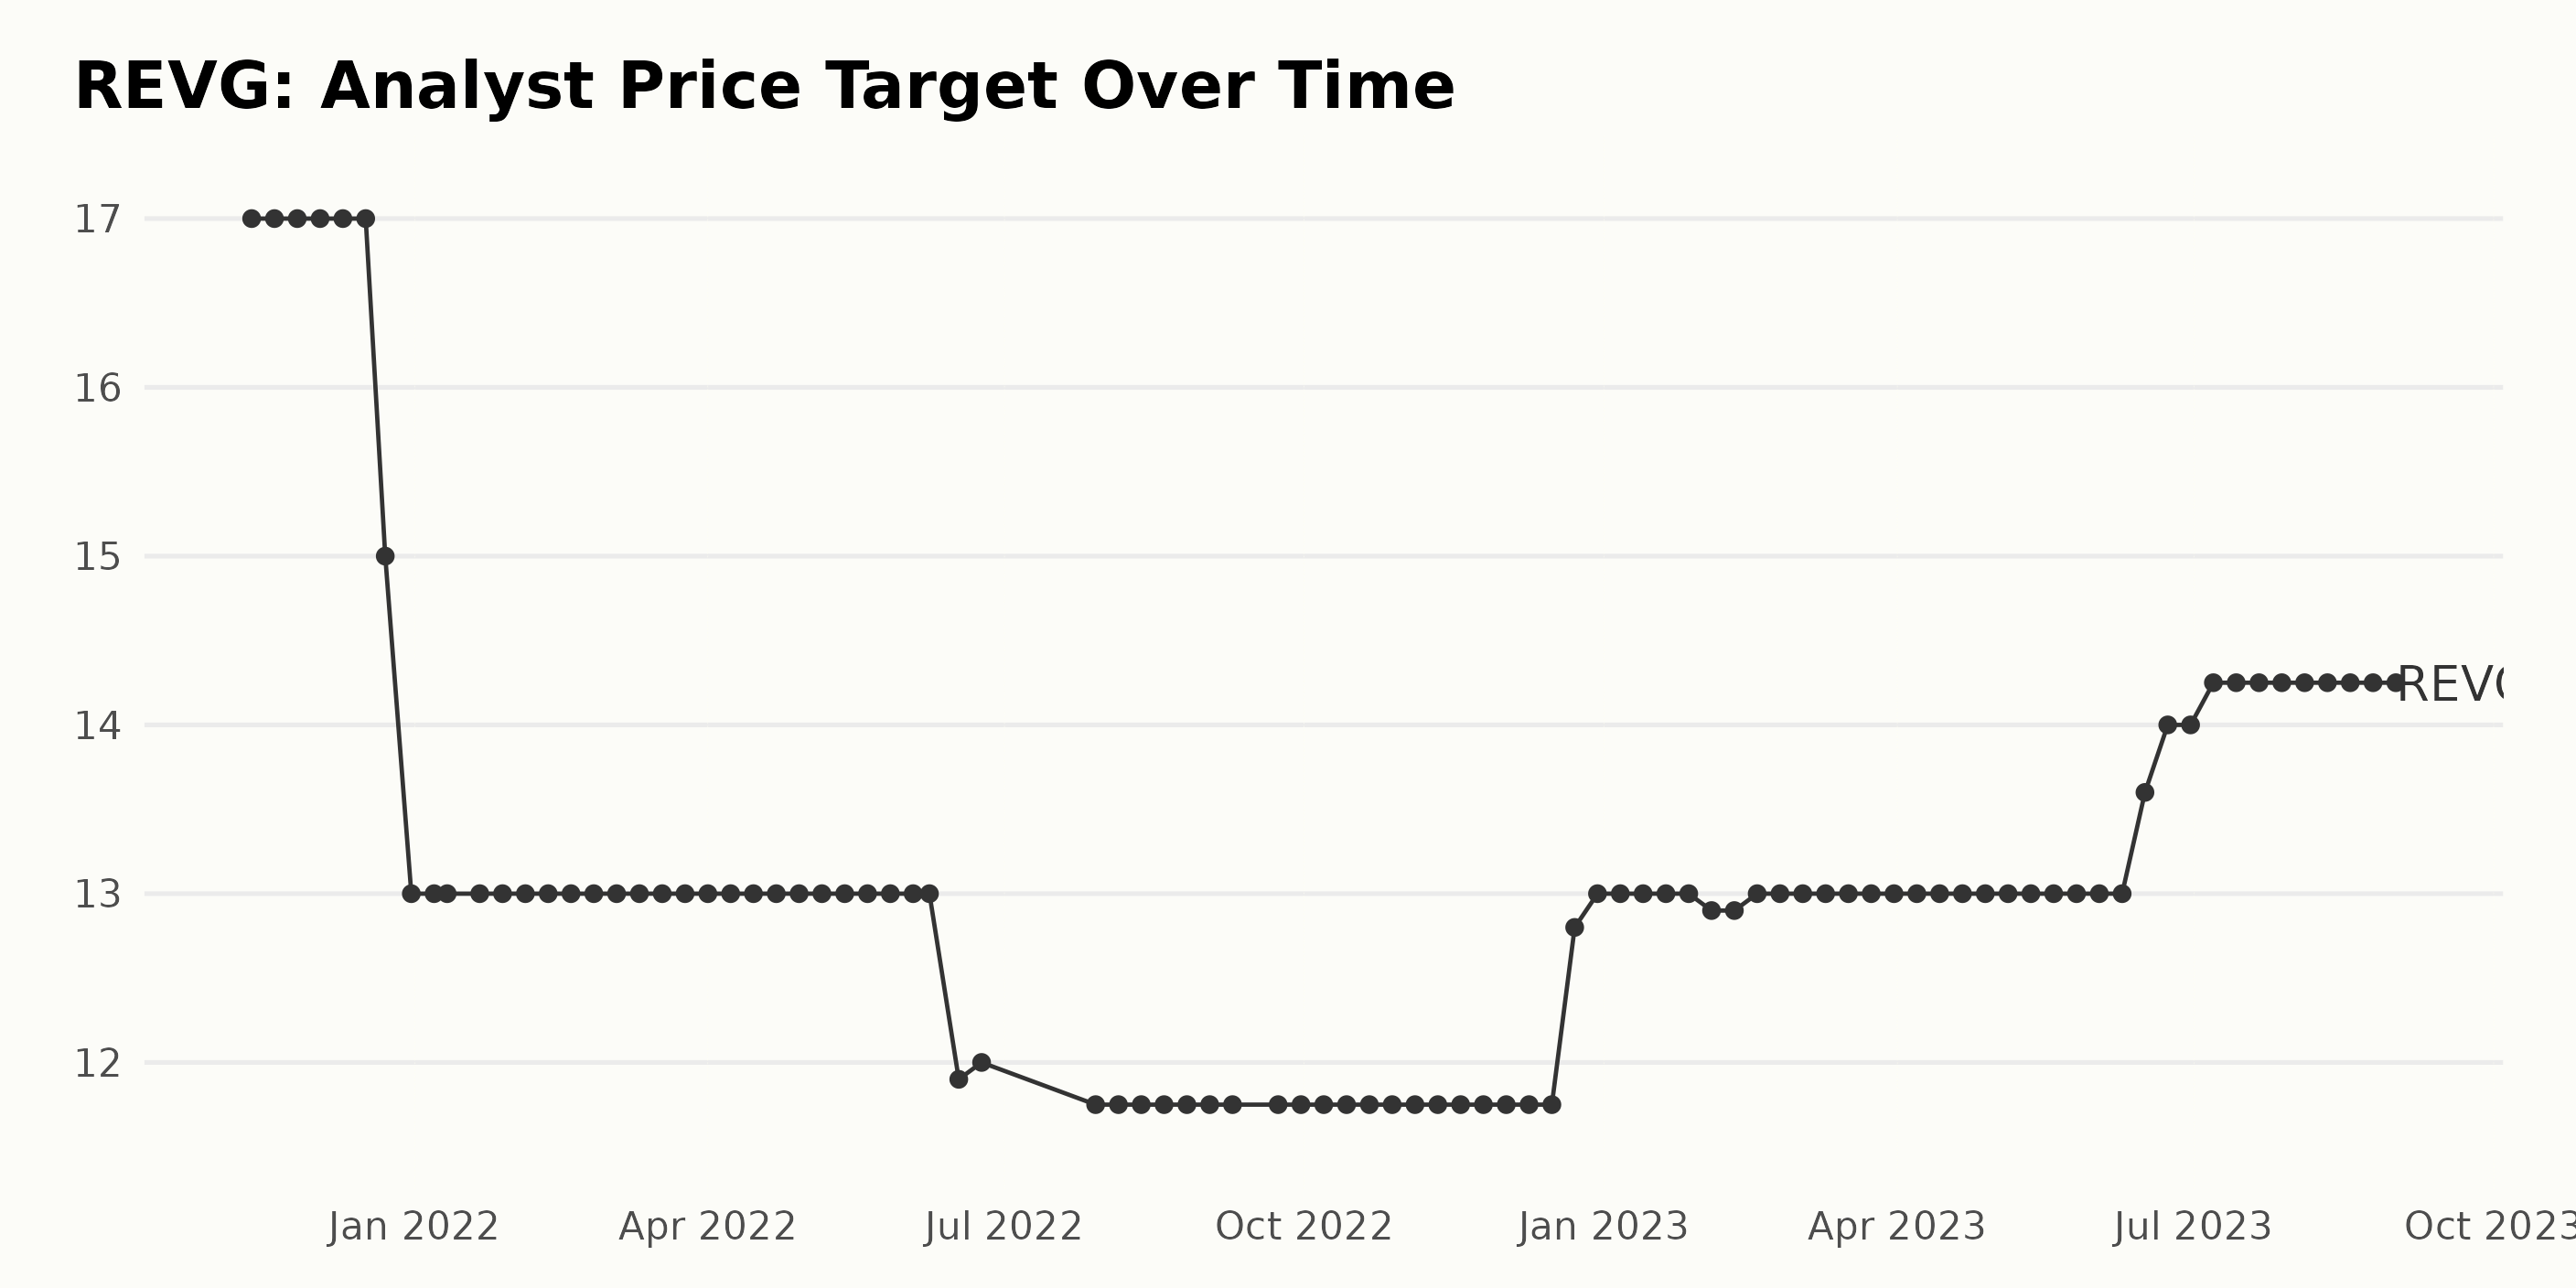
The Analyst Price Target for REVG across the data series shows varying trends and fluctuations:
- Between November 2021 and December 2021, the Analyst Price Target remained steady at $17.
- However, there was a downward shift from late December 2021, with the price target dropping to $15 and then to $13 by the end of December 2021.
- Throughout most of 2022, the price target showed a degree of stability, hovering around the $13 mark, with slight decreases noted in June ($11.9 to $12) and easing back in July to $11.75, which stayed through late December 2022.
- A significant increase to $12.8 was observed on December 23, 2022, which rose again to hit $13 by the end of the year. This uptrend continued till early February 2023 when it slightly dropped to $12.9 but soon restored to the $13 level.
- The upward trend continued, notably escalating from June 2023, hitting $13.6 in mid-June, rising to $14 later that month, and finally reaching a value of $14.25 by early July 2023, a value that held through September 2023.
Although the Analyst Price Target for REVG showed a general downward trend throughout late 2021 and 2022, consolidated around $13 for most of 2022 and early 2023, an upward turn was observed from June 2023 onwards.
REV Group’s Six-Month Stock Performance: Decline, Recovery, and Stabilization
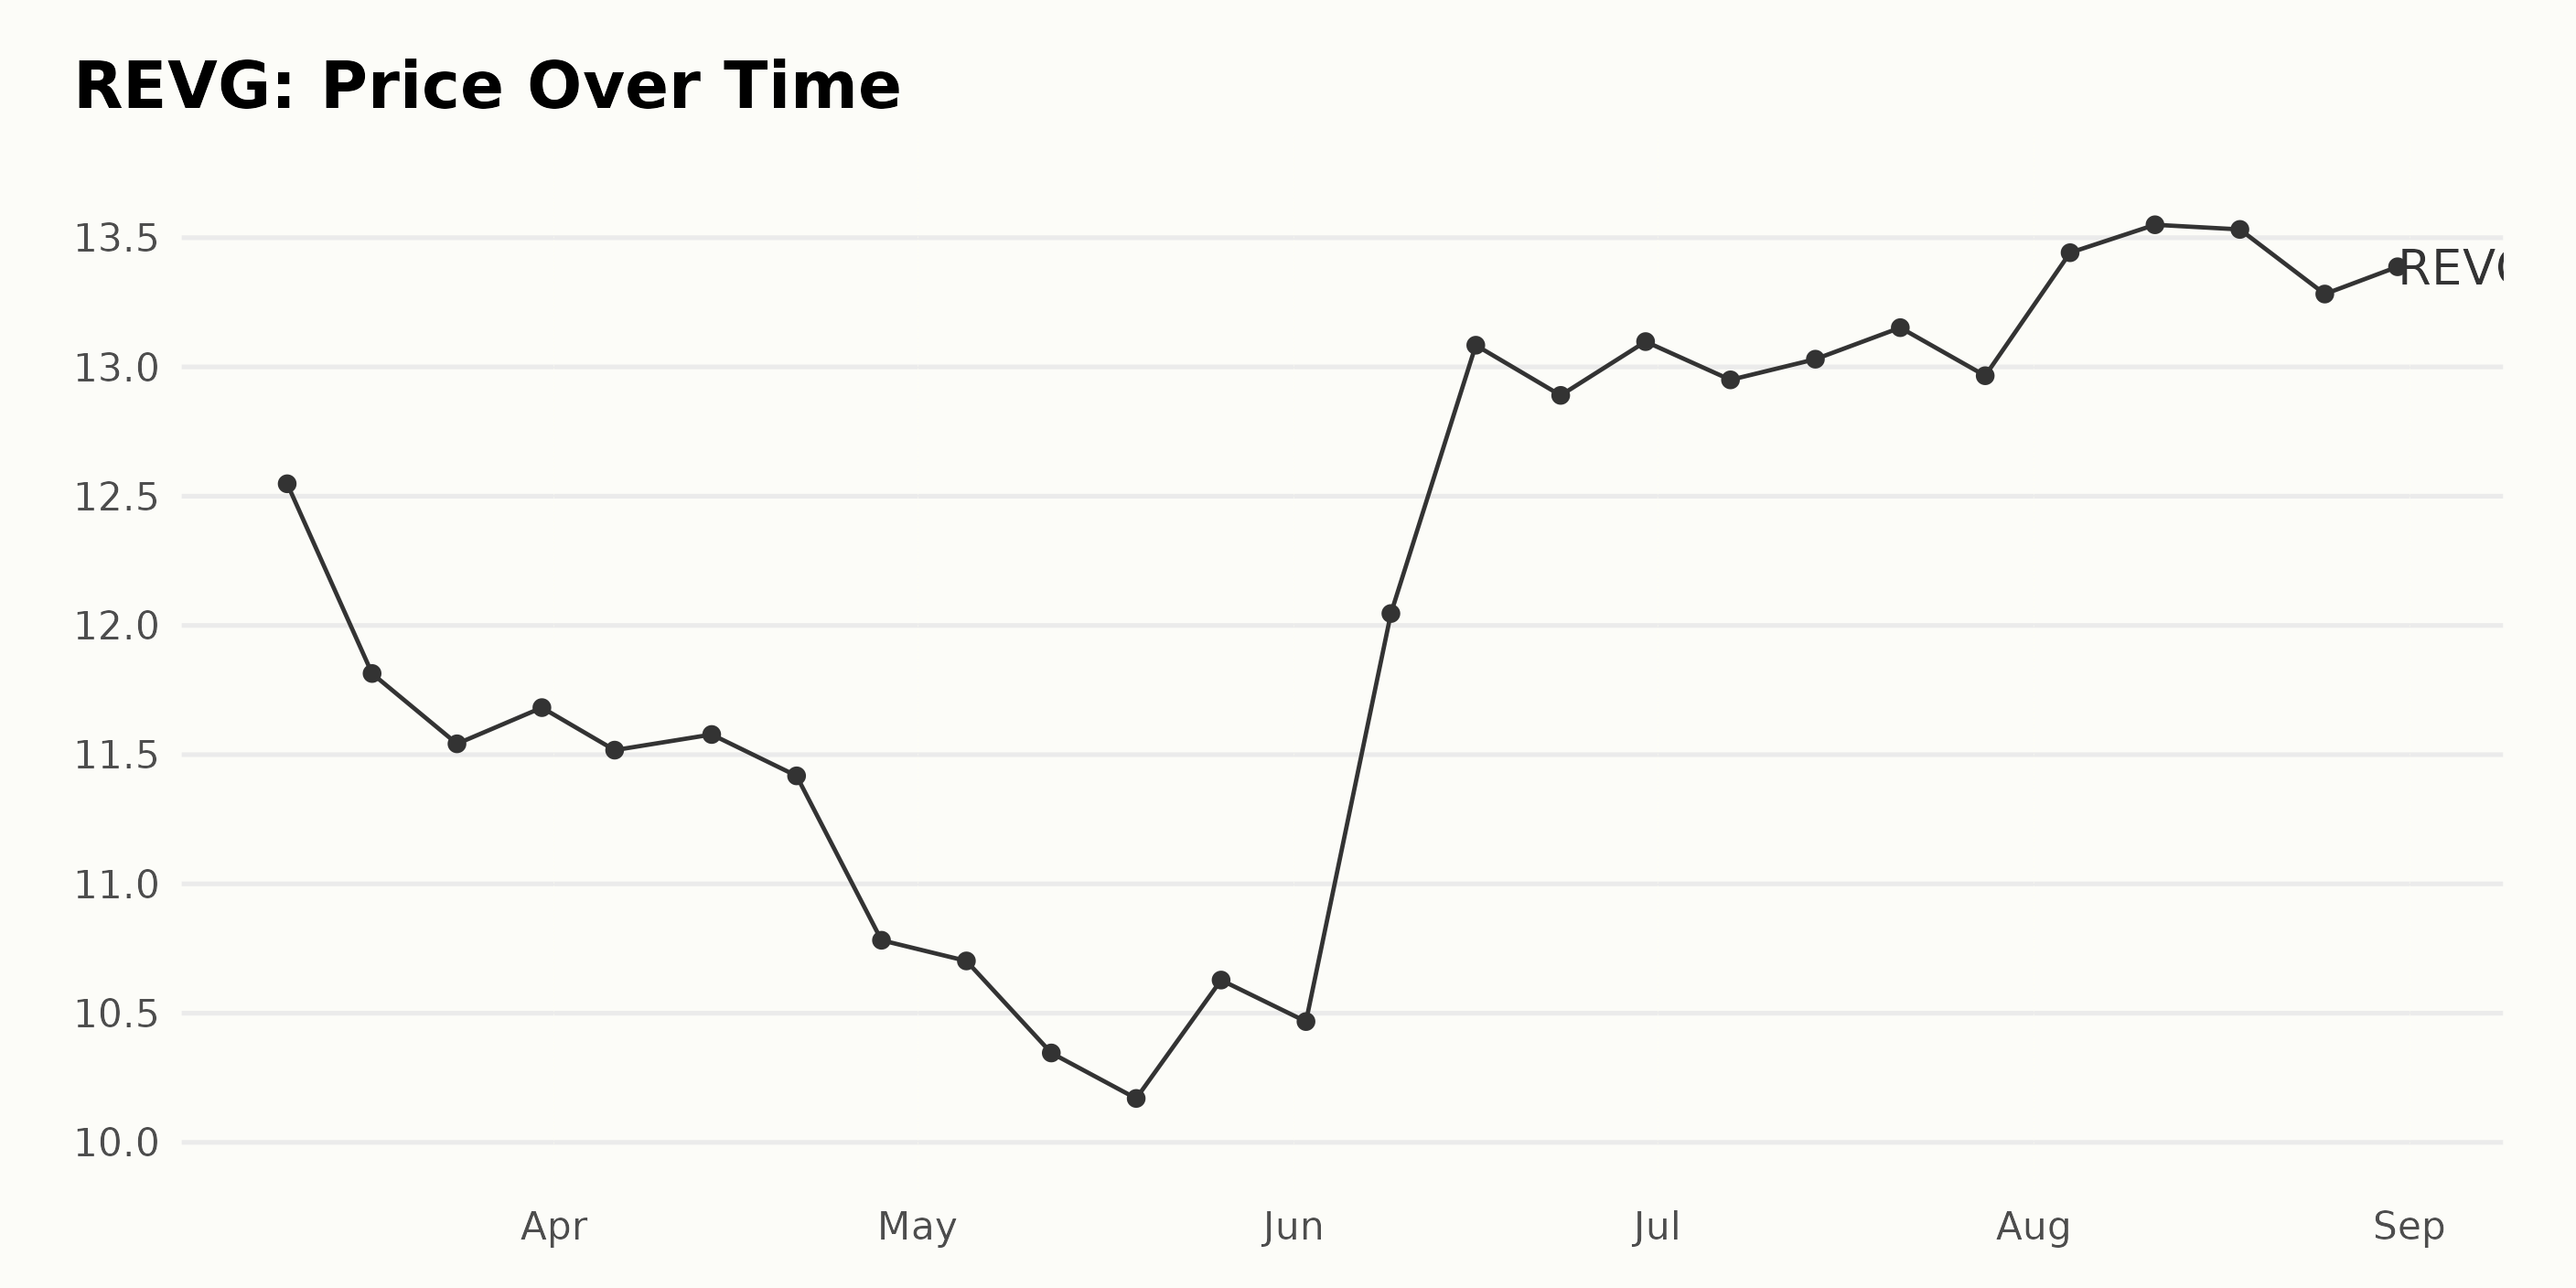
The share price data for REVG from March 2023 to August 2023 indicates a distinct trend of initial decline, followed by noticeable recovery and subsequent stability. Here’s a detailed description:
- In March 2023, the share price depreciated from $12.55 (March 10) to $11.68 by the end of the month (March 31).
- This downward trajectory continued through April, hitting a low of $10.78 by April 28.
- May saw a further dip, where shares fell to $10.17 by May 19. However, the prices started to recover towards the end of that month, closing at $10.63 by May 26.
- June marked a significant recovery period; the price improved from $10.47 (June 2) to $13.10 by the end of the month (June 30), which is an upward trend of around 25%.
- The upwards swing slowed in July, with prices showing a marginal increase from $12.95 (July 7) to $13.15 by July 21, followed by a minor dip to $12.97 by July 28.
- In August, the price showed mild volatility; it increased from $13.44 (August 4) to $13.55 (August 11), experienced a slight drop to $13.28 (August 25), and then slightly recovered to $13.39 by the end of the month.
To summarize, REVG’s stock price demonstrated a decelerating downward trend from March 2023 through late May 2023, followed by an accelerating upward trend into June, which then leveled off with moderate fluctuations throughout July and August. Here is a chart of REVG’s price over the past 180 days.
Assessing REV Group Inc.’s Performance: Growth, Value, and Momentum Ratings Explained
REVG has an overall A rating, translating to a Strong Buy in our POWR Ratings system. It is ranked #7 out of the 58 stocks in the Auto & Vehicle Manufacturers category.
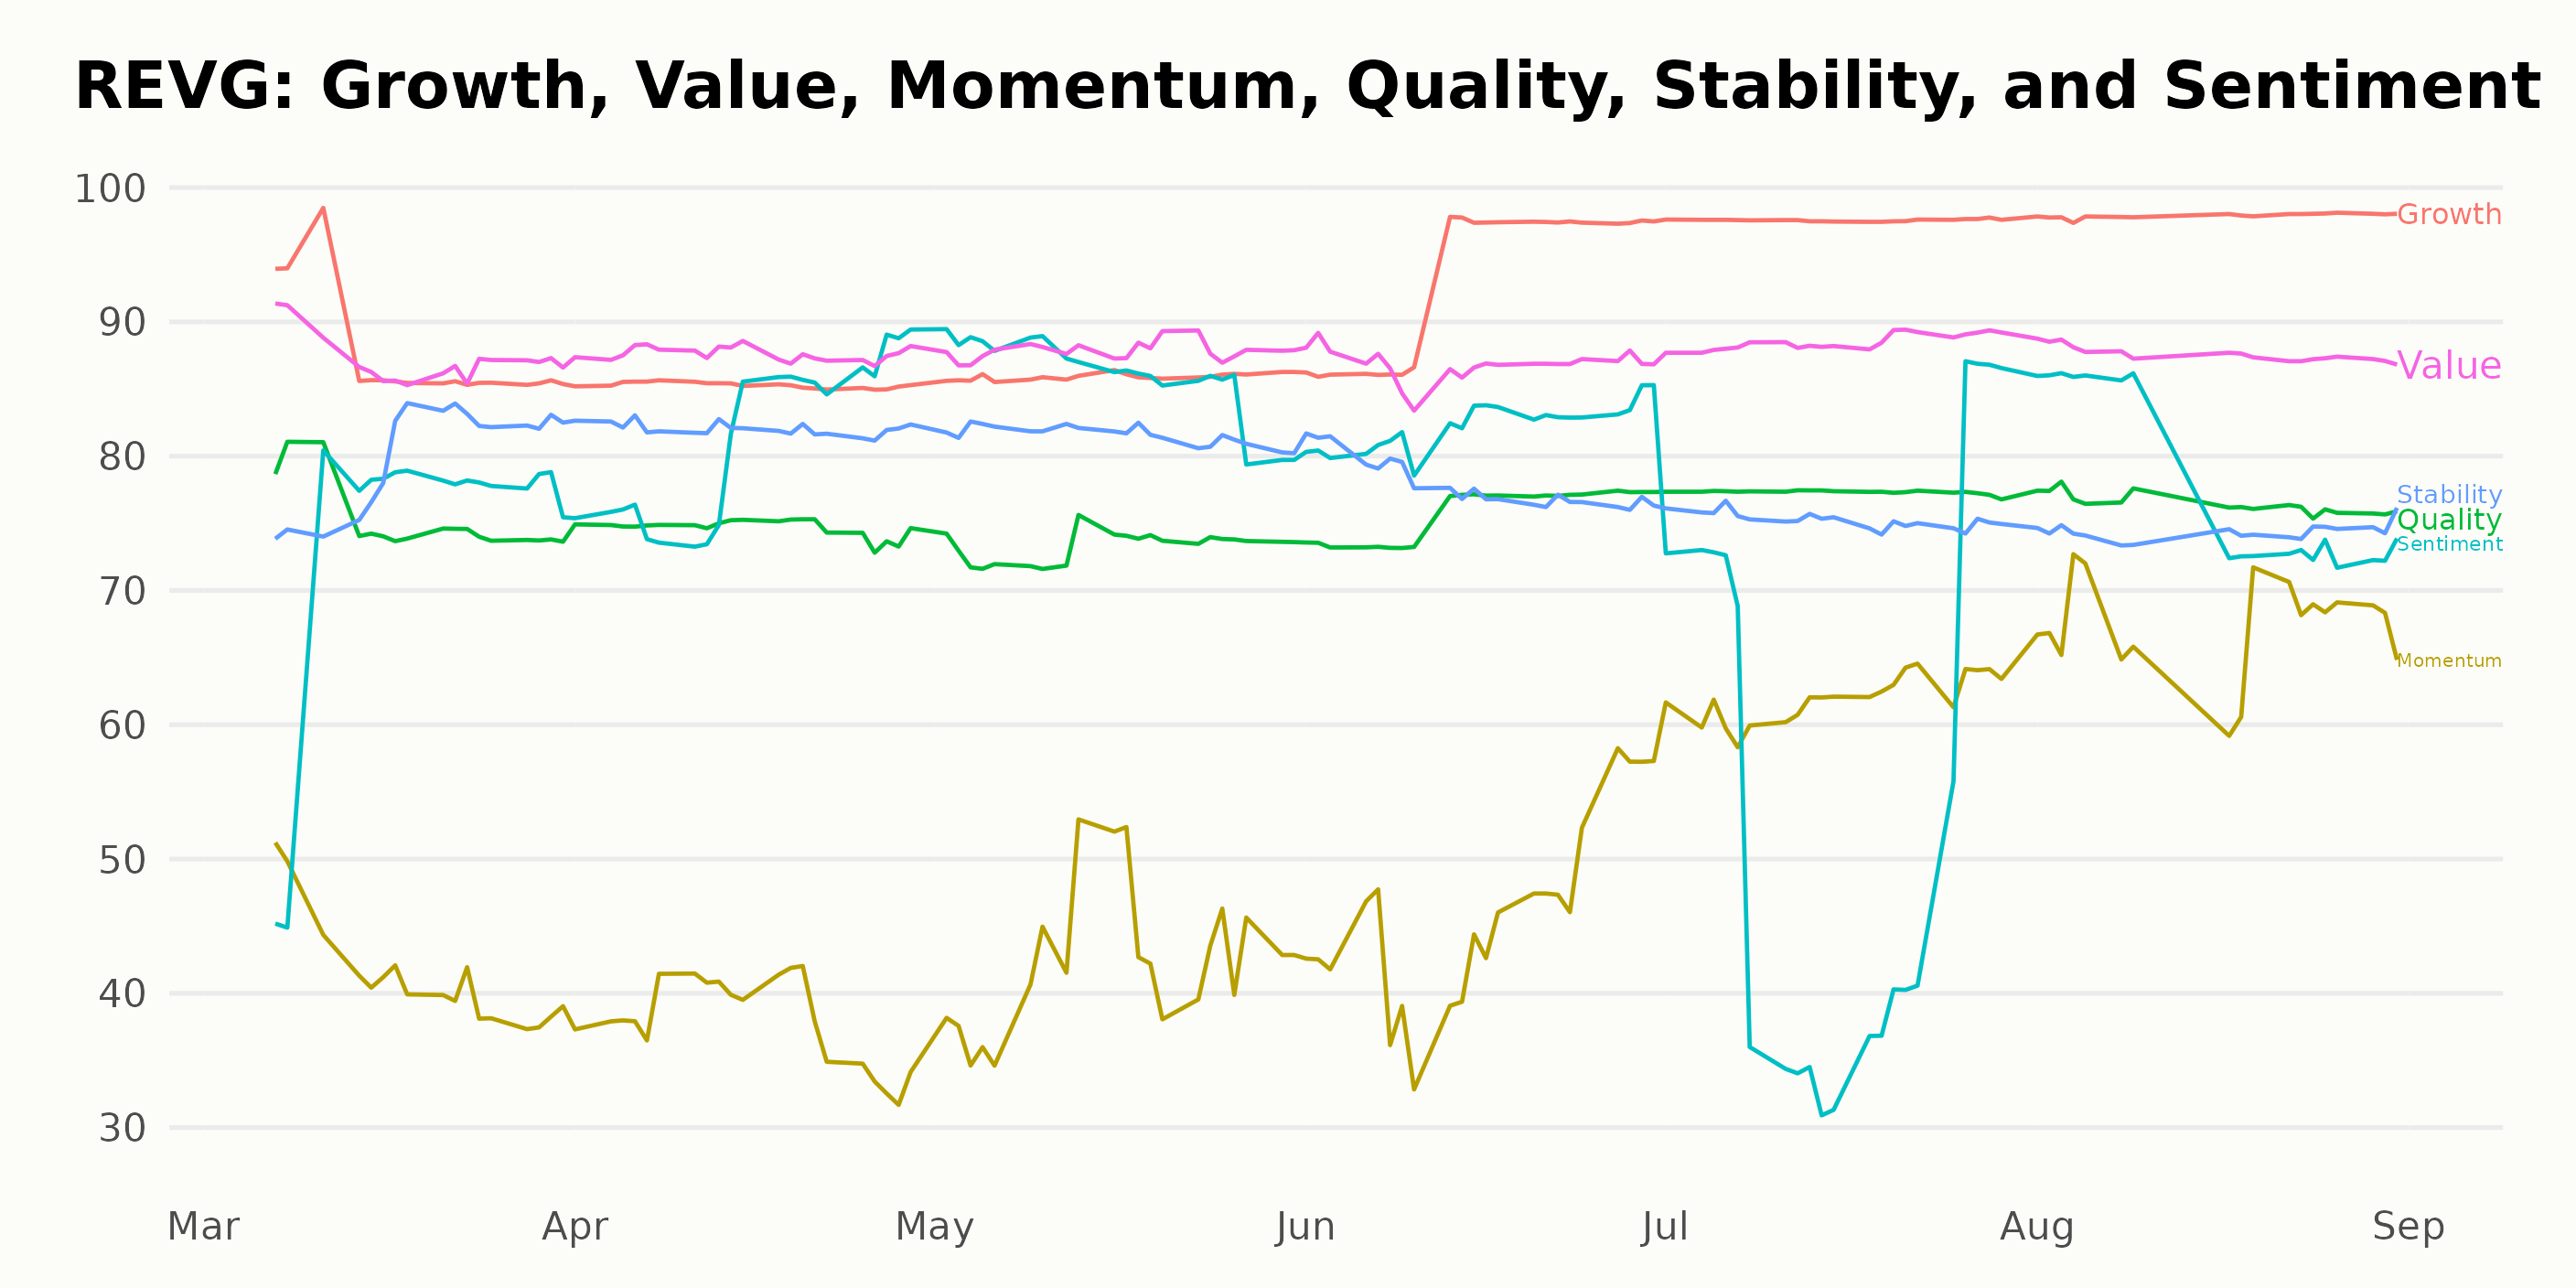
According to the POWR Ratings, REVG has made noteworthy performance across three main dimensions: Growth, Value, and Momentum. Below is a detailed breakdown of these three dimensions:
Growth
- In March 2023, the Growth dimension had a rating of 87.
- Over the months, there was a gradual increase, with this score reaching 98 by July and maintaining this rating through August 2023.
Value
- The Value dimension also started off with a strong position in March 2023, scoring 87.
- It slightly enhanced to a rating of 88 from April 2023, which continued to May and June 2023. In July 2023, it increased further to 89, then dropped back to 88 in August 2023.
Momentum
- The Momentum dimension showed an upward trend over the observed period. It started with a relatively low score of 41 in March 2023 but improved consistently until August 2023, when it reached a score of 67.
These ratings convey that the strongest dimensions for REVG are Growth and Value, while Momentum also indicates a positive trend despite starting from a lower base.
How does REV Group Inc. (REVG) Stack Up Against its Peers?
Other stocks in the Auto & Vehicle Manufacturers sector that may be worth considering are Honda Motor Company Ltd. (HMC), Stellantis N.V. (STLA), and Mazda Motor Corporation (MZDAY) -- which have better POWR Ratings. For exploring more A and B-rated Auto & Vehicle Manufacturers stocks, click here.
What To Do Next?
Discover 10 widely held stocks that our proprietary model shows have tremendous downside potential. Please make sure none of these “death trap” stocks are lurking in your portfolio:
REVG shares were unchanged in premarket trading Friday. Year-to-date, REVG has gained 8.48%, versus a 18.65% rise in the benchmark S&P 500 index during the same period.
About the Author: Subhasree Kar

Subhasree’s keen interest in financial instruments led her to pursue a career as an investment analyst. After earning a Master’s degree in Economics, she gained knowledge of equity research and portfolio management at Finlatics.
The post Is REV Group, Inc. (REVG) Showing Signs of Growth for September? appeared first on StockNews.com