
Simmons First National’s 16.3% return over the past six months has outpaced the S&P 500 by 7.3%, and its stock price has climbed to $22.75 per share. This performance may have investors wondering how to approach the situation.
Is now the time to buy Simmons First National, or should you be careful about including it in your portfolio? Dive into our full research report to see our analyst team’s opinion, it’s free.
Why Do We Think Simmons First National Will Underperform?
Despite the momentum, we’re sitting this one out for now. Here are three reasons why SFNC doesn’t excite us, plus one stock we’d rather own.
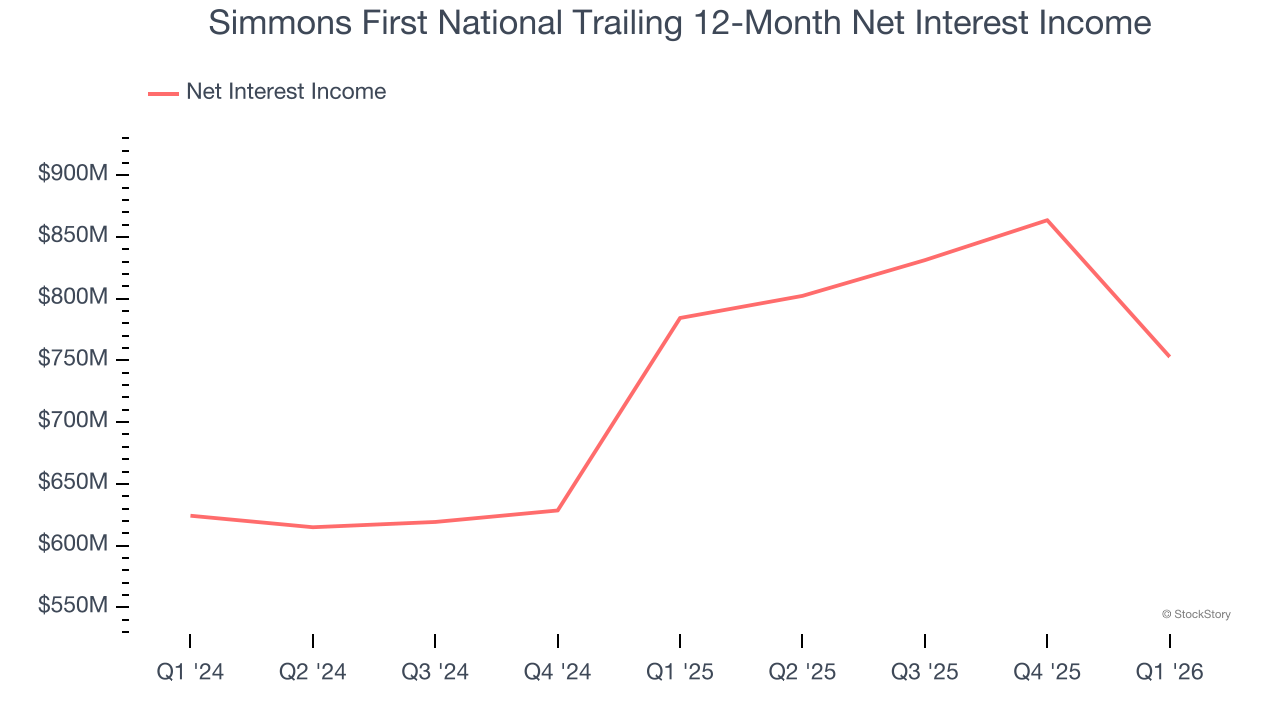
1. Net Interest Income Points to Soft Demand
While banks generate revenue from multiple sources, investors view net interest income as a cornerstone — its predictable, recurring characteristics stand in sharp contrast to the volatility of one-time fees.
Simmons First National’s net interest income has grown at a 4% annualized rate over the last five years, much worse than the broader banking industry and in line with its total revenue.
2. Efficiency Ratio Expected to Falter
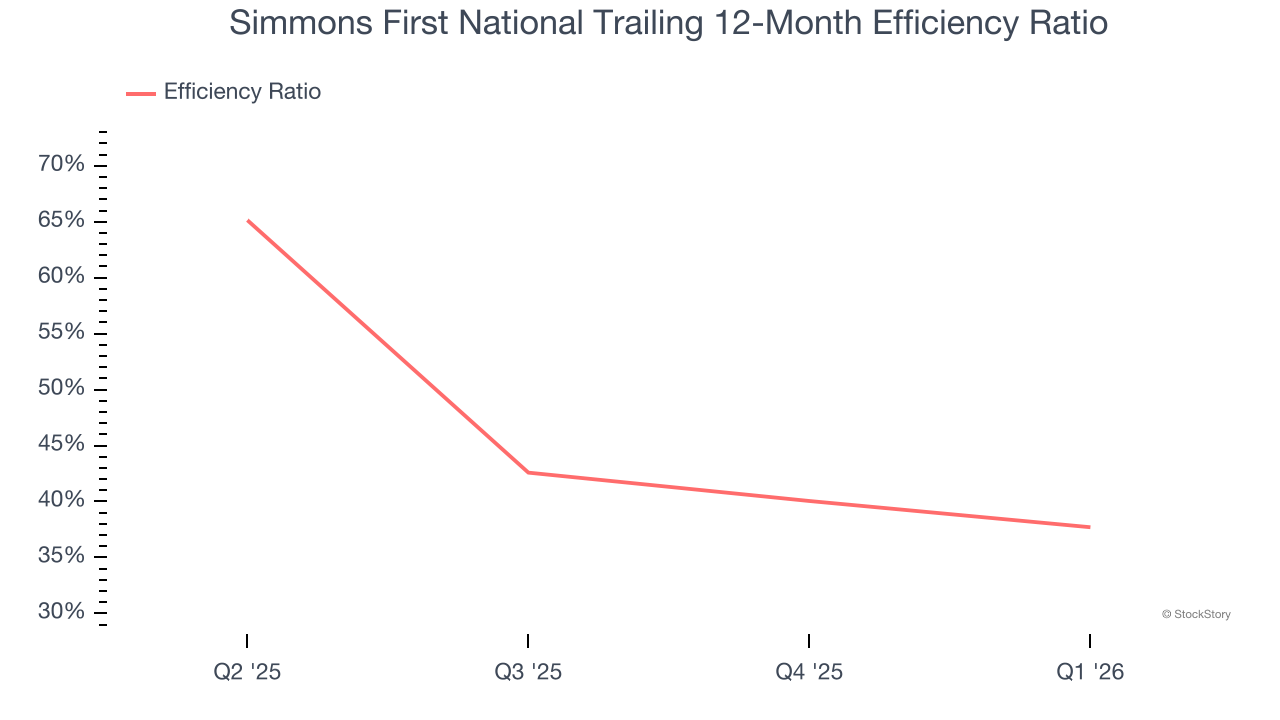
The underlying profitability of top-line growth determines the actual bottom-line impact. Banking institutions measure this dynamic using the efficiency ratio, which is calculated by dividing non-interest expenses like personnel, facilities, technology, and marketing by total revenue.
Markets emphasize efficiency ratio trends over static measurements, recognizing that revenue compositions drive different expense bases. Lower efficiency ratios signal superior performance by indicating that banks are controlling costs effectively relative to their income.
For the next 12 months, Wall Street expects Simmons First National to become less profitable as it anticipates an efficiency ratio of 55.6% compared to 37.7% over the past year.
3. EPS Trending Down
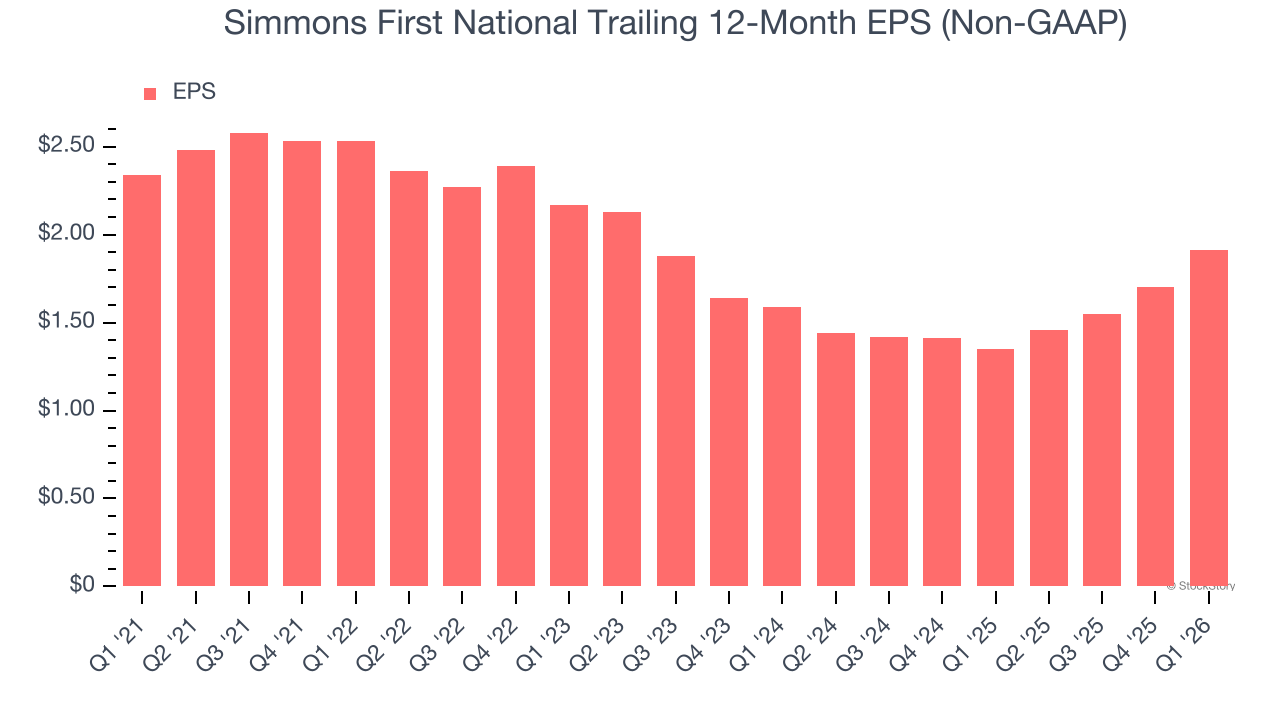
We track the long-term change in earnings per share (EPS) because it highlights whether a company’s growth is profitable.
Sadly for Simmons First National, its EPS declined by 4% annually over the last five years while its revenue grew by 3.3%. This tells us the company became less profitable on a per-share basis as it expanded.
Final Judgment
Simmons First National falls short of our quality standards. With its shares outperforming the market lately, the stock trades at 0.9× forward P/B (or $22.75 per share). This multiple tells us a lot of good news is priced in - we think there are better opportunities elsewhere. Let us point you toward our favorite semiconductor picks and shovels play.
High-Quality Stocks for All Market Conditions
ALSO WORTH WATCHING: Top 5 Momentum Stocks. The best time to own a great stock is when the market is finally noticing it. These aren’t just high-quality businesses. Something is happening with them right now. Elite fundamentals meet near-term momentum — both boxes checked at the same time.
Find out which stocks our AI platform is flagging this week. See this week’s Strong Momentum stocks — FREE. Get Our Strong Momentum Stocks for Free HERE.
Stocks that have made our list include now familiar names such as Nvidia (+1,326% between June 2020 and June 2025) as well as under-the-radar businesses like the once-small-cap company Exlservice (+354% five-year return). Find your next big winner with StockStory today.