Offshore services provider Oceaneering International (NYSE: OII) reported revenue ahead of Wall Street’s expectations in Q2 CY2026, with sales up 10% year on year to $768.2 million. Its GAAP profit of $0.65 per share was 49.8% above analysts’ consensus estimates.
Is now the time to buy Oceaneering? Find out by accessing our full research report, it’s free.
Oceaneering (OII) Q2 CY2026 Highlights:
- Revenue: $768.2 million vs analyst estimates of $736.2 million (10% year-on-year growth, 4.3% beat)
- EPS (GAAP): $0.65 vs analyst estimates of $0.43 (49.8% beat)
- Adjusted EBITDA: $114.5 million vs analyst estimates of $105.5 million (14.9% margin, 8.5% beat)
- Operating Margin: 11.5%, in line with the same quarter last year
- Free Cash Flow Margin: 4.2%, down from 6.7% in the same quarter last year
- Market Capitalization: $4.49 billion
Company Overview
Deploying a fleet of 250 tethered underwater robots around the globe, Oceaneering International (NYSE: OII) provides remotely operated underwater vehicles and subsea equipment for offshore energy exploration.
Revenue Growth
A company’s long-term performance can give signals about its business quality. Even a bad business, especially in a cyclical industry, can shine for a year or so, but a top-tier one should exhibit resilience through cycles. Unfortunately, Oceaneering’s 9.8% annualized revenue growth over the last five years was mediocre. This was below our standard for the energy upstream and integrated energy sector and is a poor baseline for our analysis.
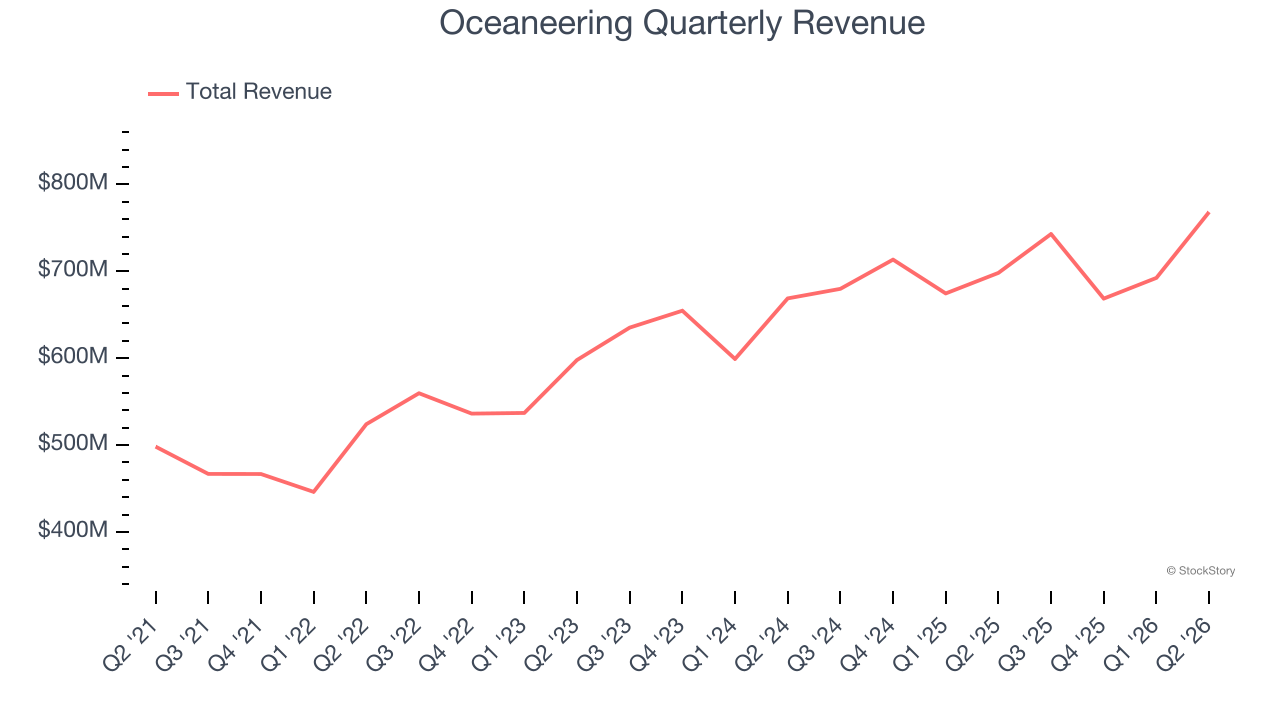
Even a long stretch in Energy can be shaped by a single commodity cycle, so extending the view to ten years adds another perspective and reveals which companies are built to grow regardless of the pricing regime. Oceaneering’s annualized revenue growth of 0.6% over the last ten years is below its five-year trend, but we still think the results were respectable.
This quarter, Oceaneering reported year-on-year revenue growth of 10%, and its $768.2 million of revenue exceeded Wall Street’s estimates by 4.3%.
ALSO WORTH WATCHING: Nvidia’s Quiet Partner. Nvidia’s chips cost a hundred grand. The connectors that make them work cost even more. One company makes them all.
Every AI server needs specialized infrastructure the chip companies don’t make. High-speed cables. Power connectors. Thermal sensors. This 90-year-old company built a monopoly on it. The AI boom just started. This stock is still flying under the radar. Claim The Stock Ticker Here for FREE.
Adjusted EBITDA Margin
Oceaneering was profitable over the last five years but held back by its large cost base. Its average EBITDA margin of 12.7% was among the worst in the energy upstream and integrated energy sector.
On the plus side, Oceaneering’s EBITDA margin rose by 4.3 percentage points over the last year.
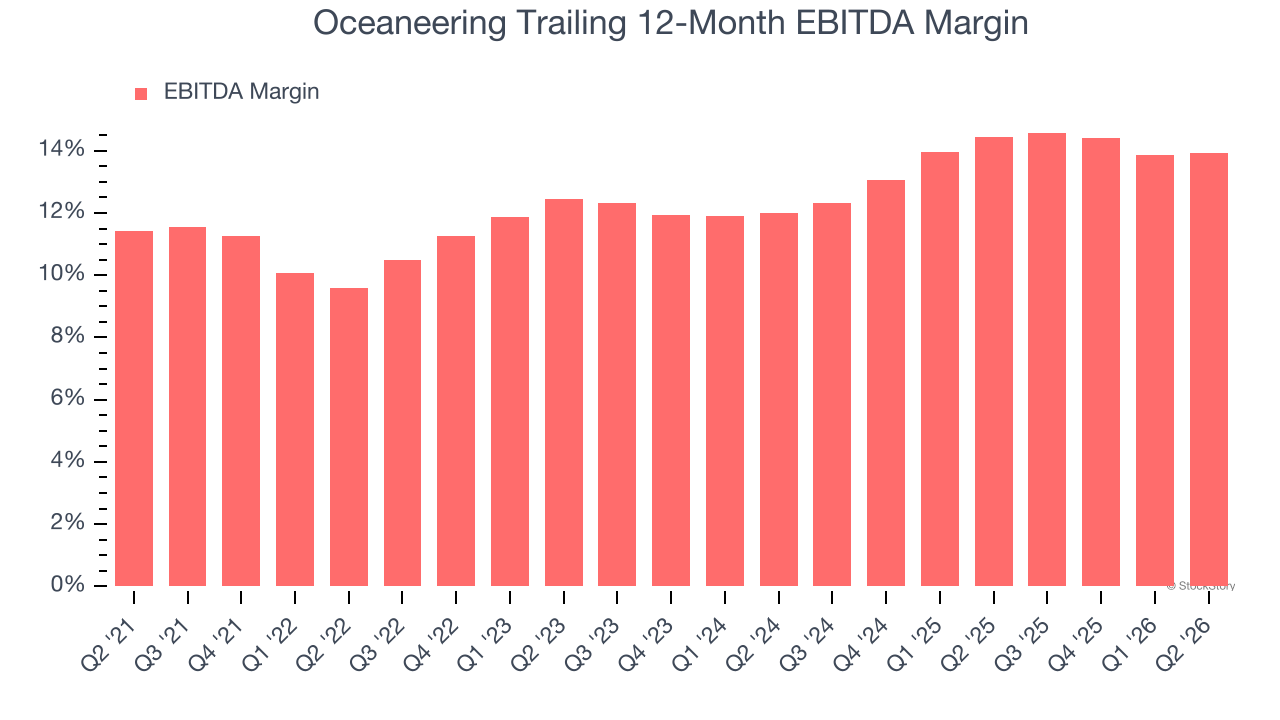
In Q2, Oceaneering generated an EBITDA margin profit margin of 14.9%, in line with the same quarter last year. This indicates the company’s overall cost structure has been relatively stable. This adjusted EBITDA beat Wall Street’s estimates by 8.5%.
Cash Is King
As mentioned above, adjusted EBITDA ignores capital structure and drilling expenditure decisions. These are two huge aspects of an Energy producer, so in order to understand a comprehensive picture of business quality, an investor needs to account for these. Said differently, adjusted EBITDA margins could be solid but free cash flow is abysmal because decline rates of the asset are extreme and the drilling is expensive. Free cash flow tells you about not only the economics of the production that has happened but how much it costs to stay in business as well (further drilling or extraction).
Oceaneering has shown weak cash profitability relative to peers over the last five years, giving the company fewer opportunities to return capital to shareholders. Its free cash flow margin averaged 4.5%, below what we’d expect for an upstream and integrated energy business.
Absolute FCF margin levels matter but so does stability of free cash flow. All else equal, we’d prefer a 25.0% average free cash flow margin that is quite steady no matter how commodity prices behave rather than extremely high margins when times are good and negative ones when they’re tough.
Oceaneering’s ratio of quarterly free cash flow volatility to WTI crude price volatility over the past five years was 20.8 (lower is better), indicating that its cash generation is far more sensitive to commodity-price swings than most peers. This elevated volatility limits its access to capital in downturns and makes it unlikely to act as a consolidator when weaker competitors come under pressure.
You may be asking why we wait until the free cash flow line to perform this stability analysis versus commodity prices. Why not compare revenue or EBITDA to WTI Crude prices in the case of Oceaneering? Because what ultimately matters is not how much revenue or profit you earn when prices are high but how much cash you can generate when prices are low. Free cash flow is the superior metric because it includes everything from hedging prowess to growth and maintenance capex to management behavior during good times and bad.
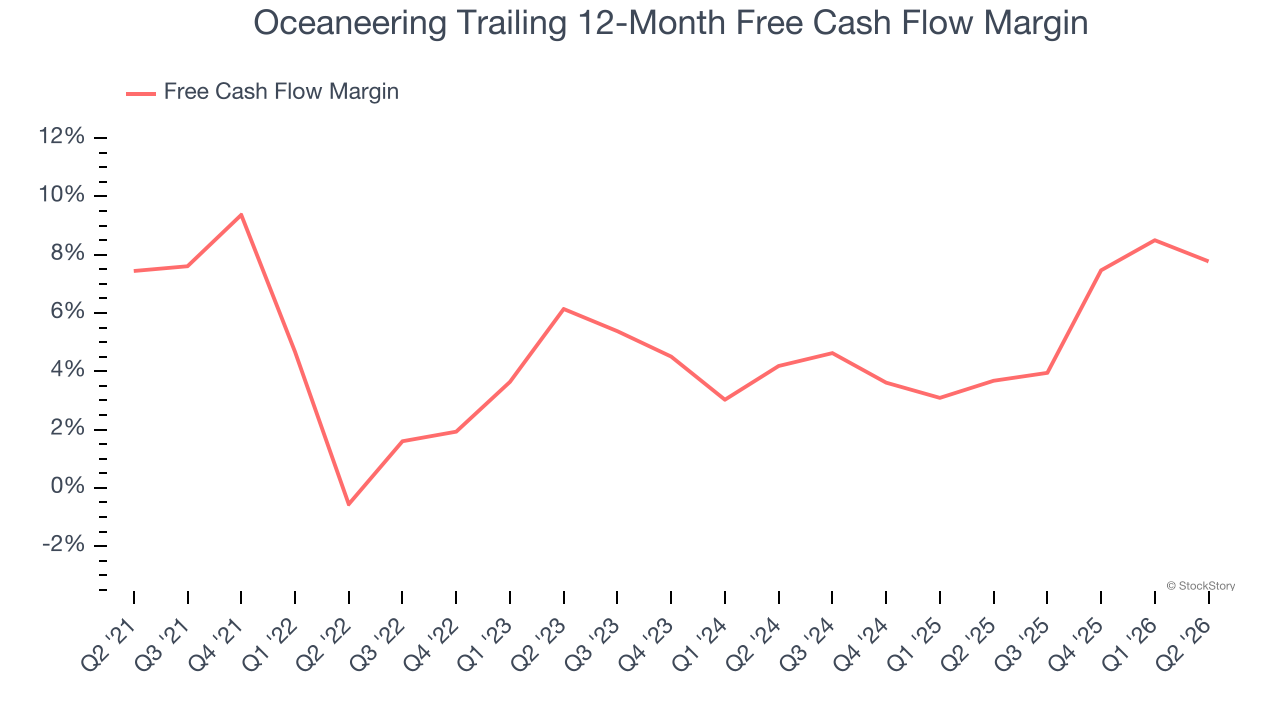
Oceaneering’s free cash flow clocked in at $32.03 million in Q2, equivalent to a 4.2% margin. The company’s cash profitability regressed as it was 2.6 percentage points lower than in the same quarter last year, prompting us to pay closer attention. Short-term fluctuations typically aren’t a big deal because investment needs can be seasonal, but we’ll be watching to see if the trend extrapolates into future quarters.
Key Takeaways from Oceaneering’s Q2 Results
It was good to see Oceaneering beat analysts’ EPS expectations this quarter. We were also excited its revenue outperformed Wall Street’s estimates by a wide margin. Zooming out, we think this was a good print with some key areas of upside. The stock traded up 3.2% to $46.40 immediately after reporting.
Oceaneering put up rock-solid earnings, but one quarter doesn’t necessarily make the stock a buy. Let’s see if this is a good investment. If you’re making that decision, you should consider the bigger picture of valuation, business qualities, as well as the latest earnings. We cover that in our actionable full research report which you can read here (it’s free).