
Regional bank holding company CVB Financial (NASDAQ: CVBF) fell short of the market’s revenue expectations in Q2 CY2026, but sales rose 41.4% year on year to $179.4 million. Its GAAP profit of $0.29 per share was 39.8% above analysts’ consensus estimates.
Is now the time to buy CVB Financial? Find out by accessing our full research report, it’s free.
CVB Financial (CVBF) Q2 CY2026 Highlights:
- Net Interest Income: $162.4 million vs analyst estimates of $167.4 million (45.5% year-on-year growth, 3% miss)
- Net Interest Margin: 3.7% vs analyst estimates of 3.7% (4.4 basis point beat)
- Revenue: $179.4 million vs analyst estimates of $184.5 million (41.4% year-on-year growth, 2.7% miss)
- Efficiency Ratio: 63.8% vs analyst estimates of 47.8% (1,595 basis point miss)
- EPS (GAAP): $0.29 vs analyst estimates of $0.21 (39.8% beat)
- Tangible Book Value per Share: $11.07 vs analyst estimates of $10.95 (4% year-on-year growth, 1.1% beat)
- Market Capitalization: $3.92 billion
David Brager, Chief Executive Officer of the Company, commented, “Our consistent financial performance is highlighted by our 197 consecutive quarters, or 49 years, of profitability, and our 147 consecutive quarters of paying cash dividends. I would like to thank our customers and associates for their continued commitment and loyalty, as well as our associates for the outstanding efforts and commitment to the successful systems conversion completed in June"
Company Overview
With roots dating back to 1974 and a focus on serving small and medium-sized businesses, CVB Financial (NASDAQ: CVBF) operates Citizens Business Bank, providing banking, lending, and trust services to businesses and individuals across California.
Sales Growth
Net interest income and fee-based revenue are the two pillars supporting bank earnings. The former captures profit from the gap between lending rates and deposit costs, while the latter encompasses charges for banking services, credit products, wealth management, and trading activities. Over the last five years, CVB Financial grew its revenue at a sluggish 4.4% compounded annual growth rate. This fell short of our benchmark for the banking sector and is a tough starting point for our analysis.
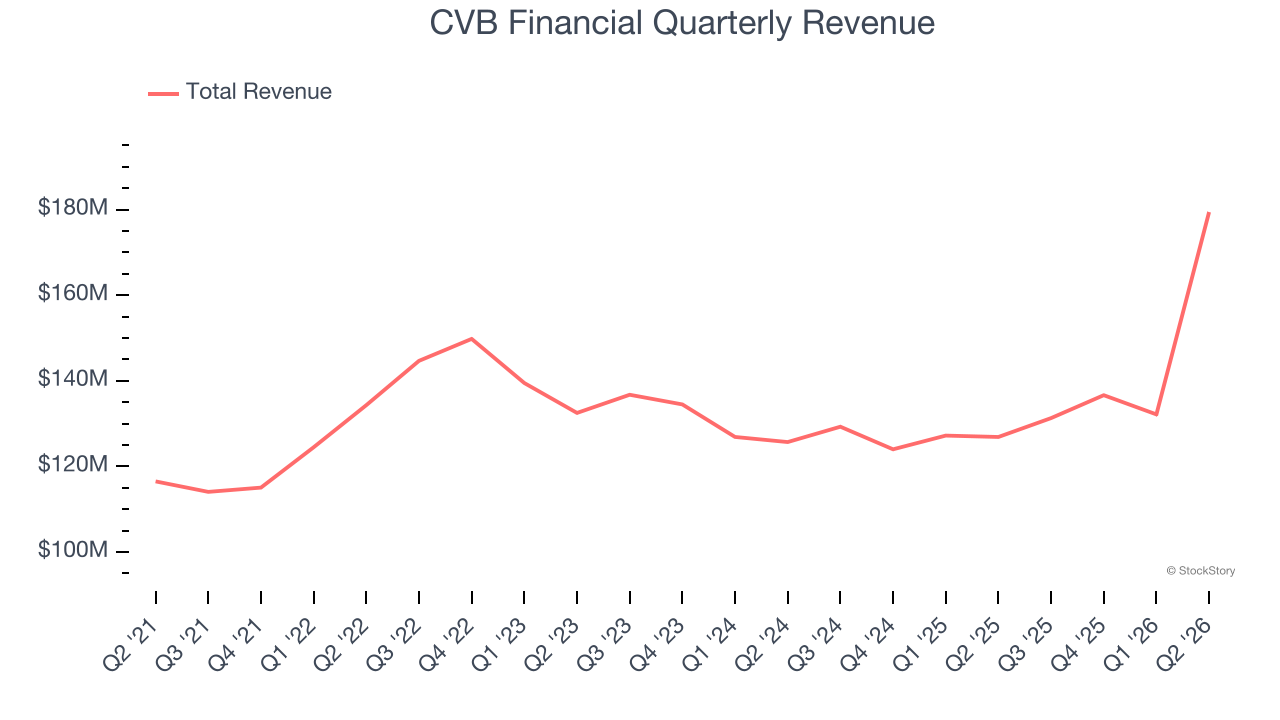
Long-term growth is the most important, but within financials, a half-decade historical view may miss recent interest rate changes and market returns. CVB Financial’s annualized revenue growth of 5.2% over the last two years aligns with its five-year trend, suggesting its demand was consistently weak. 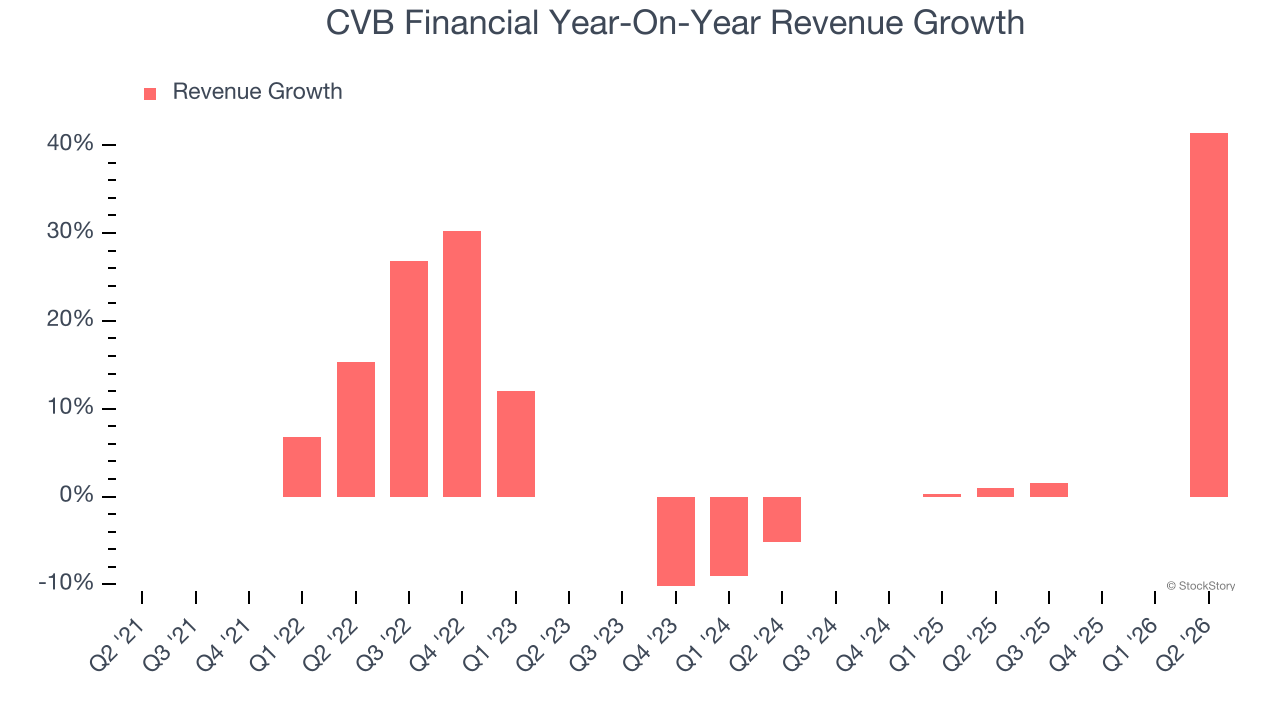 Note: Quarters not shown were determined to be outliers because they were impacted by outsized investment gains/losses that are not indicative of the recurring fundamentals of the business.
This quarter, CVB Financial achieved a magnificent 41.4% year-on-year revenue growth rate, but its $179.4 million of revenue fell short of Wall Street’s lofty estimates.
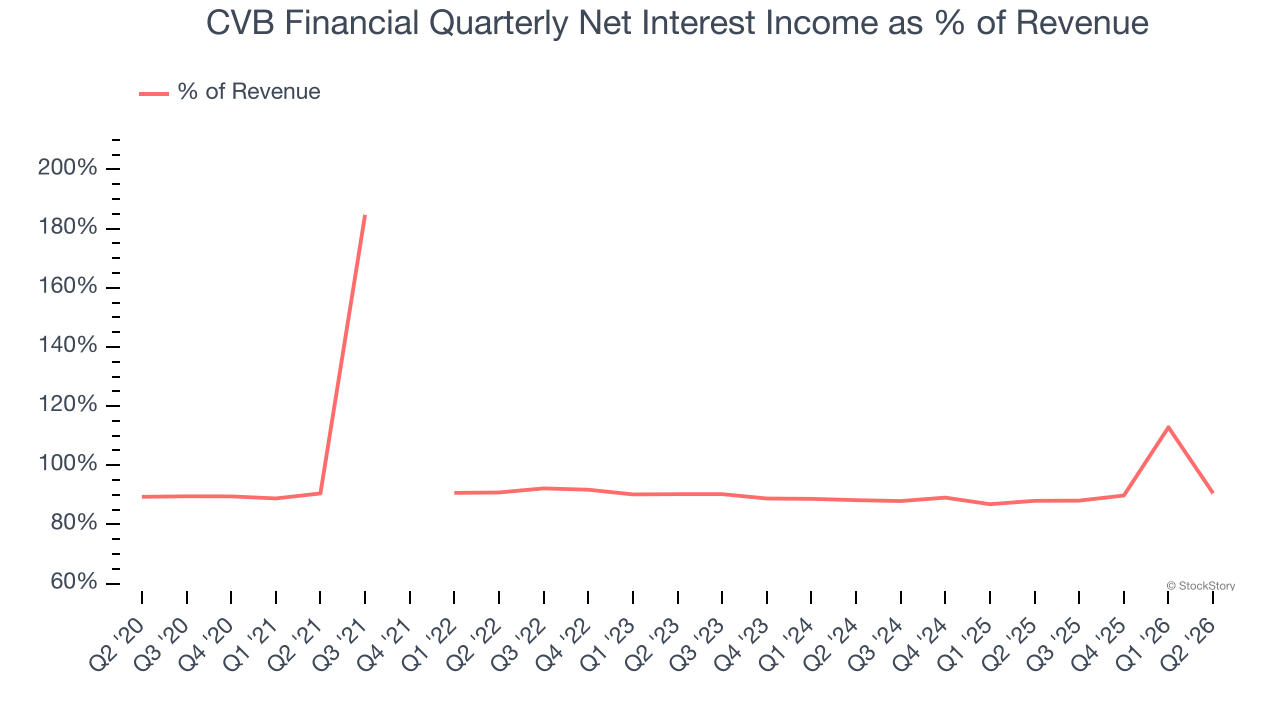
Net interest income made up 80.7% of the company’s total revenue during the last five years, meaning CVB Financial barely relies on non-interest income to drive its overall growth.
 Note: Quarters not shown were determined to be outliers because they were impacted by outsized investment gains/losses that are not indicative of the recurring fundamentals of the business.
Markets consistently prioritize net interest income growth over fee-based revenue, recognizing its superior quality and recurring nature compared to the more unpredictable non-interest income streams.
ONE MORE THING: 3 Hidden Platforms Growing 3X Faster than Amazon, Google, and PayPal. Amazon, Google, and Meta all followed the same playbook: Dominate an ignored market. Build an unbeatable moat. Scale until you’re unstoppable.
These three platforms are running that exact playbook right now. The early investors in Amazon made fortunes. The early investors in these could do the same. Get All 3 Stocks Here for FREE.
Tangible Book Value Per Share (TBVPS)
Banks are balance sheet-driven businesses because they generate earnings primarily through borrowing and lending. They’re also valued based on their balance sheet strength and ability to compound book value (another name for shareholders’ equity) over time.
When analyzing banks, tangible book value per share (TBVPS) takes precedence over many other metrics. This measure isolates genuine per-share value by removing intangible assets of debatable liquidation worth. Traditional metrics like EPS are helpful but face distortion from M&A activity and loan loss accounting rules.
CVB Financial’s TBVPS grew at a sluggish 2% annual clip over the last five years. However, TBVPS growth has accelerated recently, growing by 7.7% annually over the last two years from $9.55 to $11.07 per share.
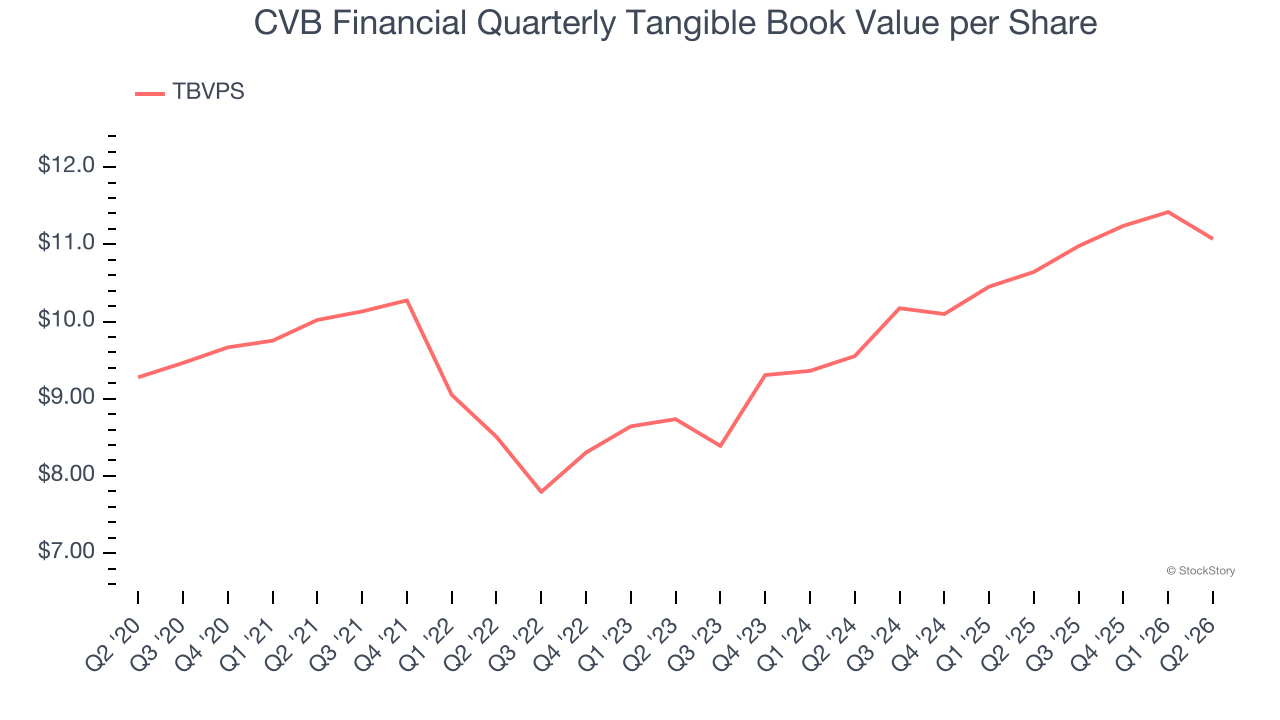
Over the next 12 months, Consensus estimates call for CVB Financial’s TBVPS to grow by 9.3% to $12.11, paltry growth rate.
Key Takeaways from CVB Financial’s Q2 Results
It was good to see CVB Financial beat analysts’ EPS expectations this quarter. We were also happy its tangible book value per share narrowly outperformed Wall Street’s estimates. On the other hand, its revenue missed and its net interest income fell short of Wall Street’s estimates. Overall, this was a softer quarter. The stock remained flat at $22.17 immediately after reporting.
CVB Financial underperformed this quarter, but does that create an opportunity to invest right now? The latest quarter does matter, but not nearly as much as longer-term fundamentals and valuation, when deciding if the stock is a buy. We cover that in our actionable full research report which you can read here (it’s free).