
Regional banking company F.N.B. Corporation (NYSE: FNB) fell short of the market’s revenue expectations in Q2 CY2026 as sales rose 4.9% year on year to $462.7 million. Its GAAP profit of $0.42 per share was in line with analysts’ consensus estimates.
Is now the time to buy F.N.B. Corporation? Find out by accessing our full research report, it’s free.
F.N.B. Corporation (FNB) Q2 CY2026 Highlights:
- Net Interest Income: $365.7 million vs analyst estimates of $373.2 million (5.3% year-on-year growth, 2% miss)
- Net Interest Margin: 3.3% vs analyst estimates of 3.3% (5.5 basis point miss)
- Revenue: $462.7 million vs analyst estimates of $469 million (4.9% year-on-year growth, 1.4% miss)
- Efficiency Ratio: 53.7% vs analyst estimates of 53.6% (11.3 basis point miss)
- EPS (GAAP): $0.42 vs analyst estimates of $0.42 (in line)
- Tangible Book Value per Share: $12.24 vs analyst estimates of $12.32 (9.9% year-on-year growth, 0.7% miss)
- Market Capitalization: $6.79 billion
"F.N.B. Corporation's second quarter results reflect the successful execution of our technology-focused strategic business model, highlighted by a 17% year-over-year increase in EPS to $0.42. Record revenue of $463 million drove a 9% year-over-year increase in pre-provision net revenue (non-GAAP) and another quarter of positive operating leverage. Tangible book value per common share (non-GAAP) increased 10% compared to June 30, 2025, and return on average tangible common equity (non-GAAP) equaled 14%," said F.N.B. Corporation Chairman, President and Chief Executive Officer, Vincent J. Delie, Jr.
Company Overview
Tracing its roots back to 1864 during the Civil War era, F.N.B. Corporation (NYSE: FNB) is a diversified financial services holding company that provides banking, wealth management, and insurance services to consumers and businesses across seven states and Washington, D.C.
Sales Growth
From lending activities to service fees, most banks build their revenue model around two income sources. Interest rate spreads between loans and deposits create the first stream, with the second coming from charges on everything from basic bank accounts to complex investment banking transactions. Over the last five years, F.N.B. Corporation grew its revenue at a mediocre 8.1% compounded annual growth rate. This fell short of our benchmark for the banking sector and is a tough starting point for our analysis.
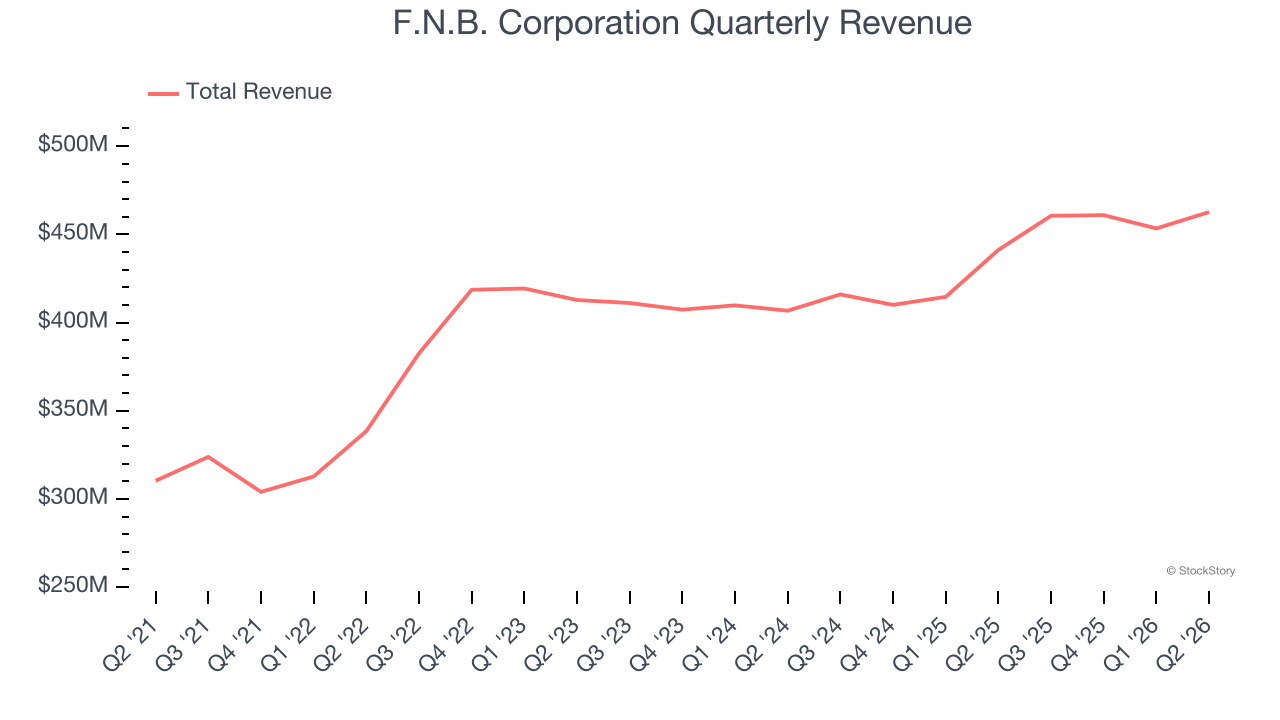
Long-term growth is the most important, but within financials, a half-decade historical view may miss recent interest rate changes and market returns. F.N.B. Corporation’s recent performance shows its demand has slowed as its annualized revenue growth of 6% over the last two years was below its five-year trend. We’re wary when companies in the sector see decelerations in revenue growth, as it could signal changing consumer tastes aided by low switching costs. 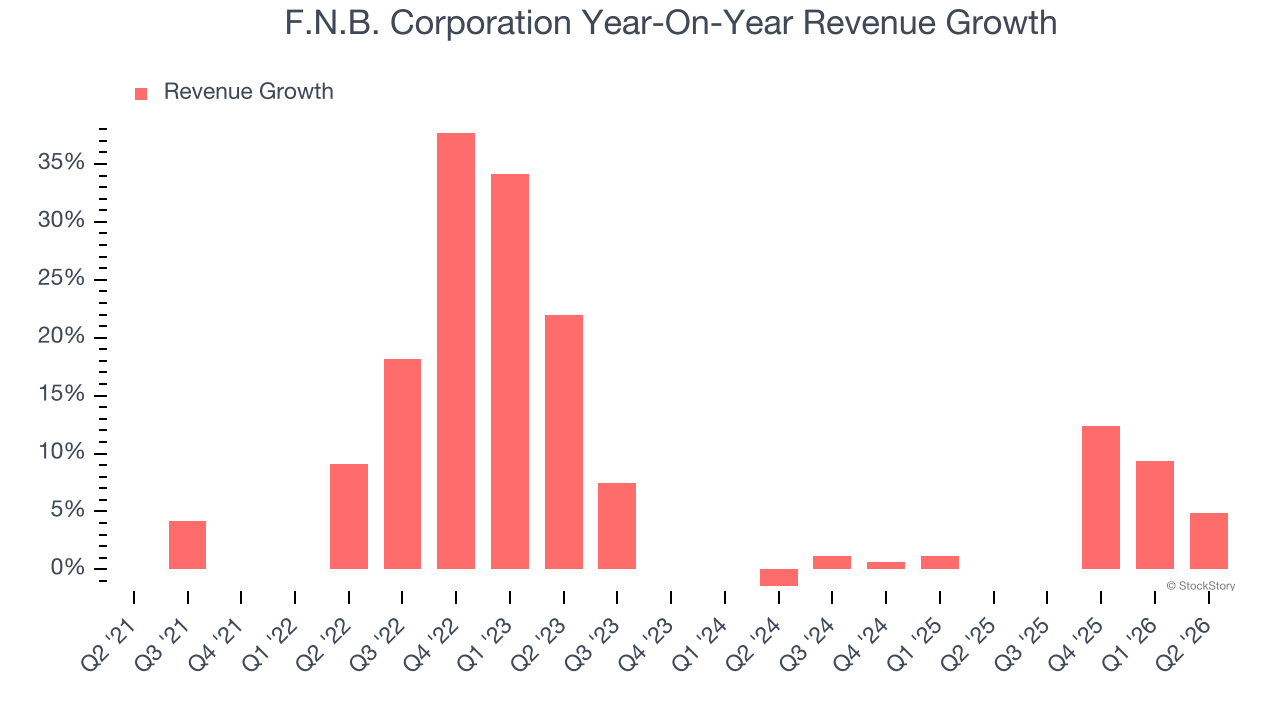 Note: Quarters not shown were determined to be outliers because they were impacted by outsized investment gains/losses that are not indicative of the recurring fundamentals of the business.
This quarter, F.N.B. Corporation’s revenue grew by 4.9% year on year to $462.7 million, falling short of Wall Street’s estimates.
Net interest income made up 77.8% of the company’s total revenue during the last five years, meaning lending operations are F.N.B. Corporation’s largest source of revenue.
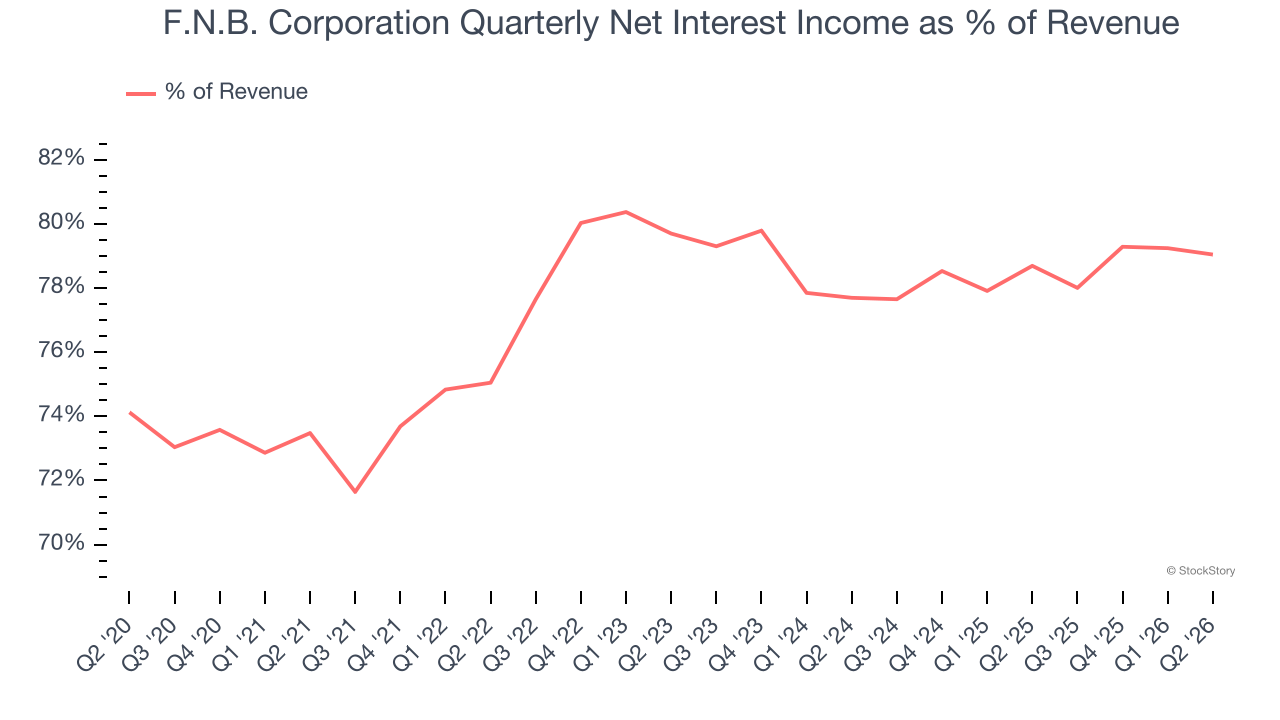
Our experience and research show the market cares primarily about a bank’s net interest income growth as non-interest income is considered a lower-quality and non-recurring revenue source.
WHILE YOU’RE HERE: The Next Palantir? One satellite company captures images of every point on Earth. Every single day. The Pentagon wants it. Hedge funds are using it to beat earnings. You’ve probably never heard of it.
This is what the early days of Palantir looked like before it became a giant. Same playbook. Different technology. If you missed Palantir, you need to see this. Claim The Stock Ticker for Free HERE.
Tangible Book Value Per Share (TBVPS)
Banks profit by intermediating between depositors and borrowers, making them fundamentally balance sheet-driven enterprises. Market participants emphasize balance sheet quality and sustained book value growth when evaluating these institutions.
Because of this, tangible book value per share (TBVPS) emerges as the critical performance benchmark. By excluding intangible assets with uncertain liquidation values, this metric captures real, liquid net worth per share. Traditional metrics like EPS are helpful but face distortion from M&A activity and loan loss accounting rules.
F.N.B. Corporation’s TBVPS grew at an excellent 8.3% annual clip over the last five years. TBVPS growth has also accelerated recently, growing by 11.3% annually over the last two years from $9.88 to $12.24 per share.
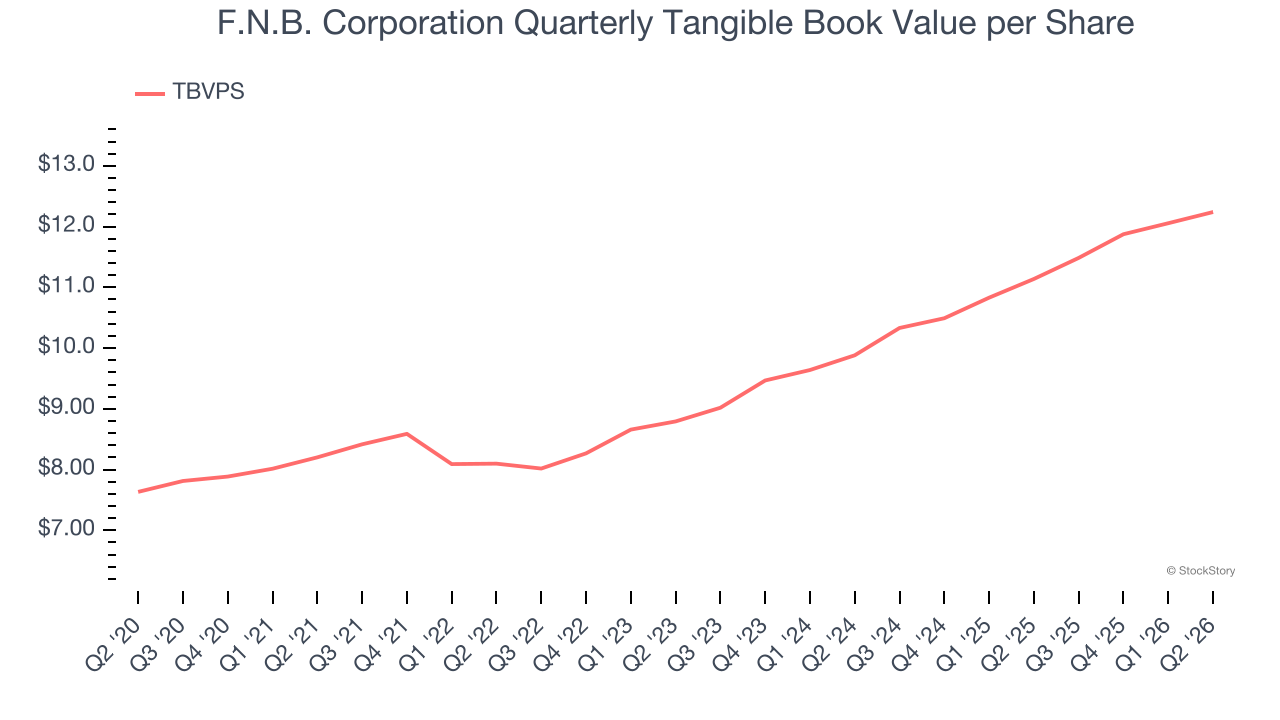
Over the next 12 months, Consensus estimates call for F.N.B. Corporation’s TBVPS to grow by 10.7% to $13.55, mediocre growth rate.
Key Takeaways from F.N.B. Corporation’s Q2 Results
We struggled to find many positives in these results. Its net interest income missed and its revenue fell slightly short of Wall Street’s estimates. Overall, this was a softer quarter. The stock traded down 1.9% to $19.05 immediately following the results.
F.N.B. Corporation underperformed this quarter, but does that create an opportunity to invest right now? When making that decision, it’s important to consider its valuation, business qualities, as well as what has happened in the latest quarter. We cover that in our actionable full research report which you can read here (it’s free).