
Commercial asset marketplace RB Global (NYSE: RBA) reported Q1 CY2026 results topping the market’s revenue expectations, with sales up 11.4% year on year to $1.23 billion. Its non-GAAP profit of $1.01 per share was 4.3% above analysts’ consensus estimates.
Is now the time to buy RB Global? Find out by accessing our full research report, it’s free.
RB Global (RBA) Q1 CY2026 Highlights:
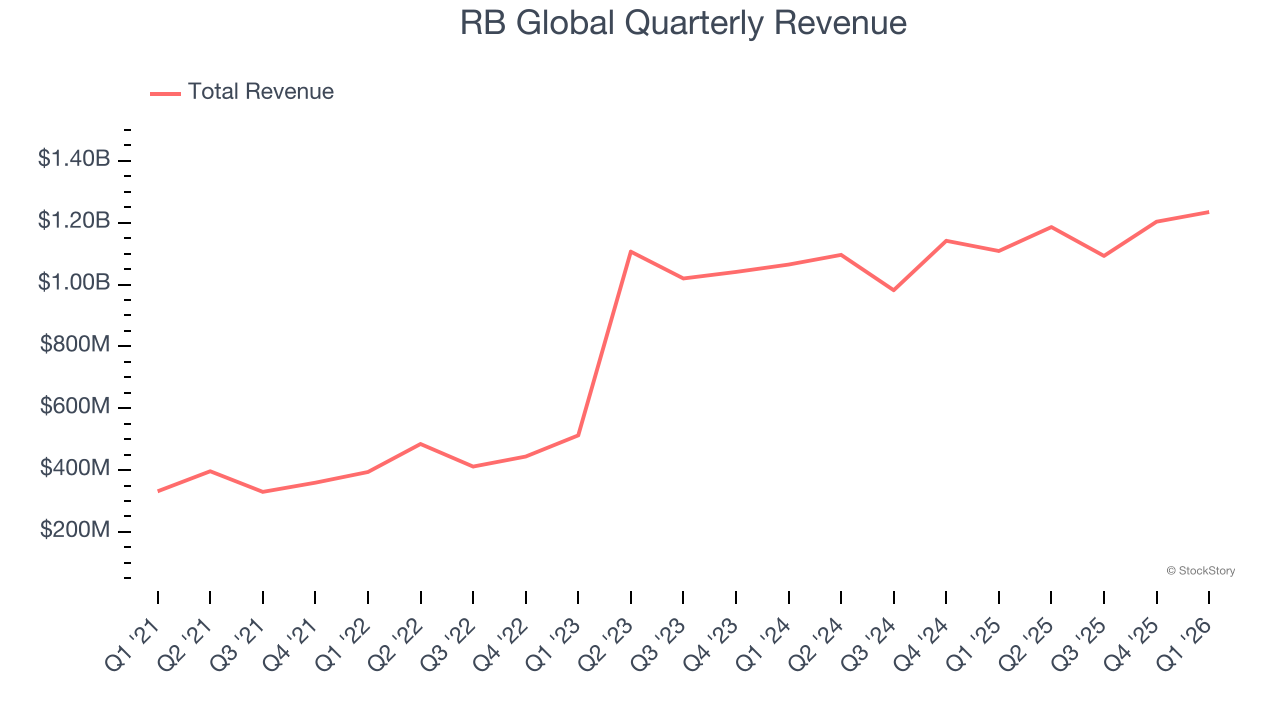
- Revenue: $1.23 billion vs analyst estimates of $1.15 billion (11.4% year-on-year growth, 6.9% beat)
- Adjusted EPS: $1.01 vs analyst estimates of $0.97 (4.3% beat)
- Adjusted EBITDA: $362.7 million vs analyst estimates of $345.2 million (29.4% margin, 5.1% beat)
- EBITDA guidance for the full year is $1.52 billion at the midpoint, above analyst estimates of $1.47 billion
- Operating Margin: 17.6%, in line with the same quarter last year
- Free Cash Flow Margin: 14%, up from 6.5% in the same quarter last year
- Market Capitalization: $19.5 billion
Company Overview
Born from the 1958 founding of Ritchie Bros. Auctioneers and rebranded in 2023, RB Global (NYSE: RBA) operates global marketplaces that connect buyers and sellers of commercial assets, vehicles, and equipment across multiple industries.
Revenue Growth
A company’s long-term sales performance is one signal of its overall quality. Any business can experience short-term success, but top-performing ones enjoy sustained growth for years.
With $4.72 billion in revenue over the past 12 months, RB Global is one of the larger companies in the business services industry and benefits from a well-known brand that influences purchasing decisions.
As you can see below, RB Global’s sales grew at an incredible 26.9% compounded annual growth rate over the last five years. This is a great starting point for our analysis because it shows RB Global’s demand was higher than many business services companies.
Long-term growth is the most important, but within business services, a half-decade historical view may miss new innovations or demand cycles. RB Global’s annualized revenue growth of 5.6% over the last two years is below its five-year trend, but we still think the results were respectable. 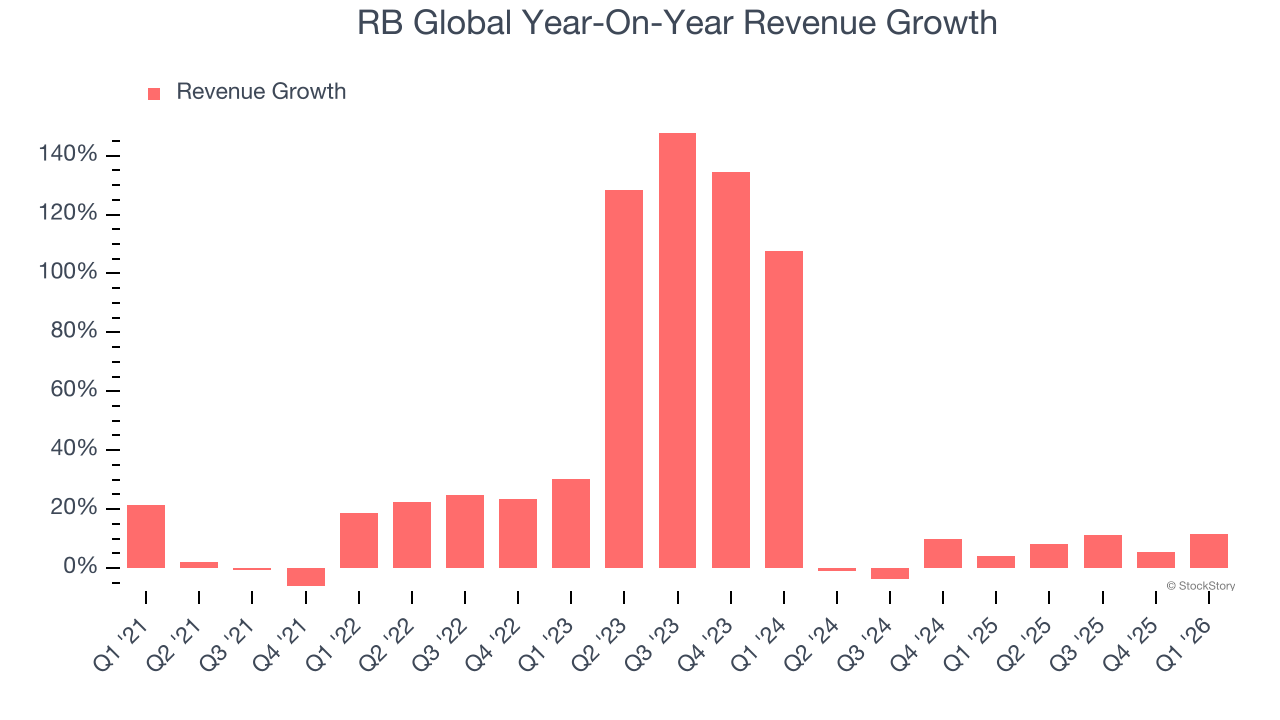
This quarter, RB Global reported year-on-year revenue growth of 11.4%, and its $1.23 billion of revenue exceeded Wall Street’s estimates by 6.9%.
Looking ahead, sell-side analysts expect revenue to grow 3.1% over the next 12 months, a slight deceleration versus the last two years. This projection doesn't excite us and indicates its products and services will see some demand headwinds. At least the company is tracking well in other measures of financial health.
ONE MORE THING: The $21 AI Application Stock Wall Street Forgot. While Wall Street obsesses over who’s building AI, one company is already using it to print money. And nobody’s paying attention.
AI chip stocks trade at ridiculous valuations. This company processes a trillion consumer signals monthly using AI and trades at a third of the price. The gap won’t last. The institutions will figure it out. You need to see this first. Read the FREE Report Before They Notice.
Adjusted Operating Margin
Adjusted operating margin is an important measure of profitability as it shows the portion of revenue left after accounting for all core expenses – everything from the cost of goods sold to advertising and wages. It’s also useful for comparing profitability across companies because it excludes non-recurring expenses, interest on debt, and taxes.
RB Global’s adjusted operating margin has generally stayed the same over the last 12 months, averaging 25.1% over the last five years. This profitability was elite for a business services business thanks to its efficient cost structure and economies of scale.
Looking at the trend in its profitability, RB Global’s adjusted operating margin might fluctuated slightly but has generally stayed the same over the last five years. This raises questions about the company’s expense base because its revenue growth should have given it leverage on its fixed costs, resulting in better economies of scale and profitability.
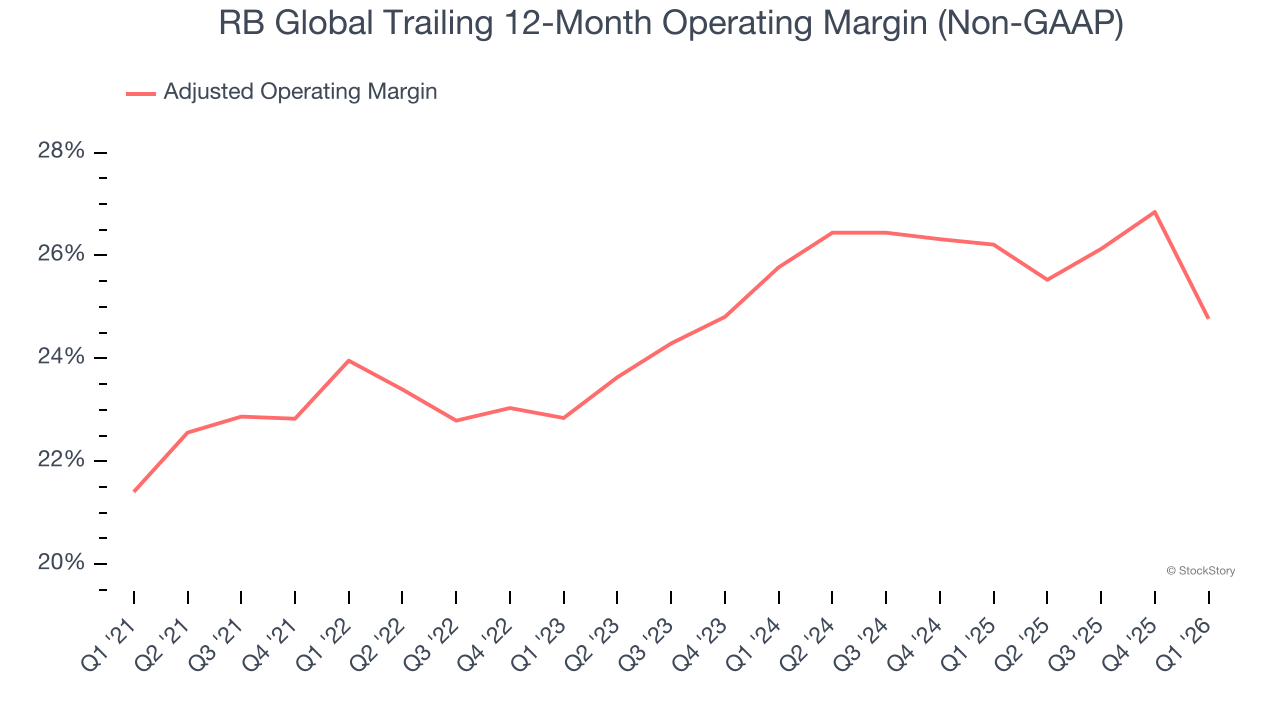
In Q1, RB Global generated an adjusted operating margin profit margin of 18.9%, down 7.9 percentage points year on year. This contraction shows it was less efficient because its expenses grew faster than its revenue.
Earnings Per Share
We track the long-term change in earnings per share (EPS) for the same reason as long-term revenue growth. Compared to revenue, however, EPS highlights whether a company’s growth is profitable.
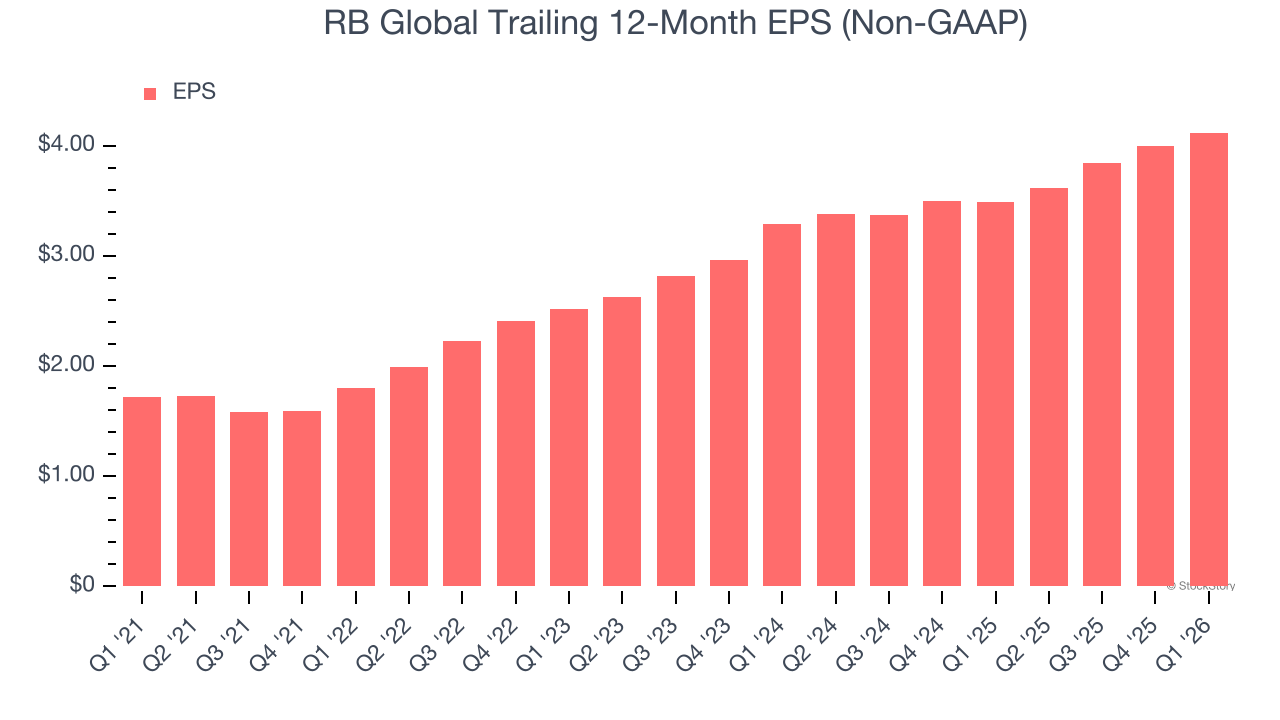
RB Global’s EPS grew at an astounding 19.1% compounded annual growth rate over the last five years. Despite its adjusted operating margin improvement during that time, this performance was lower than its 26.9% annualized revenue growth, telling us that non-fundamental factors such as interest and taxes affected its ultimate earnings.
Like with revenue, we analyze EPS over a more recent period because it can provide insight into an emerging theme or development for the business.
For RB Global, its two-year annual EPS growth of 11.9% was lower than its five-year trend. This wasn’t great, but at least the company was successful in other measures of financial health.
In Q1, RB Global reported adjusted EPS of $1.01, up from $0.89 in the same quarter last year. This print beat analysts’ estimates by 4.3%. Over the next 12 months, Wall Street expects RB Global’s full-year EPS of $4.12 to grow 10%.
Key Takeaways from RB Global’s Q1 Results
We were impressed by how significantly RB Global blew past analysts’ revenue expectations this quarter. We were also glad its EPS outperformed Wall Street’s estimates. Zooming out, we think this quarter featured some important positives. The stock traded up 4.3% to $109.49 immediately after reporting.
RB Global may have had a good quarter, but does that mean you should invest right now? The latest quarter does matter, but not nearly as much as longer-term fundamentals and valuation, when deciding if the stock is a buy. We cover that in our actionable full research report which you can read here (it’s free).