Athletic apparel company Under Armour (NYSE: UAA) met Wall Street’s revenue expectations in Q1 CY2026, but sales were flat year on year at $1.17 billion. Its non-GAAP loss of $0.03 per share was $0.01 below analysts’ consensus estimates.
Is now the time to buy Under Armour? Find out by accessing our full research report, it’s free.
Under Armour (UAA) Q1 CY2026 Highlights:
- Revenue: $1.17 billion vs analyst estimates of $1.17 billion (flat year on year, in line)
- Adjusted EPS: -$0.03 vs analyst estimates of -$0.02 ($0.01 miss)
- Adjusted EBITDA: $38.01 million vs analyst estimates of $39.78 million (3.2% margin, 4.4% miss)
- Adjusted EPS guidance for the upcoming financial year 2027 is $0.10 at the midpoint, missing analyst estimates by 55.9%
- Operating Margin: -2.9%, up from -6.1% in the same quarter last year
- Free Cash Flow was -$347.3 million compared to -$231 million in the same quarter last year
- Constant Currency Revenue fell 4.2% year on year (-10% in the same quarter last year)
- Market Capitalization: $2.54 billion
"Our fiscal 2026 performance reflects the ongoing intentional steps we're taking to reset the business and restore the discipline required to operate as a best-in-class brand," said Kevin Plank, President and CEO of Under Armour.
Company Overview
Founded in 1996 by a former University of Maryland football player, Under Armour (NYSE: UAA) is an apparel brand specializing in sportswear designed to improve athletic performance.
Revenue Growth
A company’s long-term performance is an indicator of its overall quality. Any business can experience short-term success, but top-performing ones enjoy sustained growth for years. Unfortunately, Under Armour struggled to consistently increase demand as its $4.97 billion of sales for the trailing 12 months was close to its revenue five years ago. This wasn’t a great result and is a sign of poor business quality.
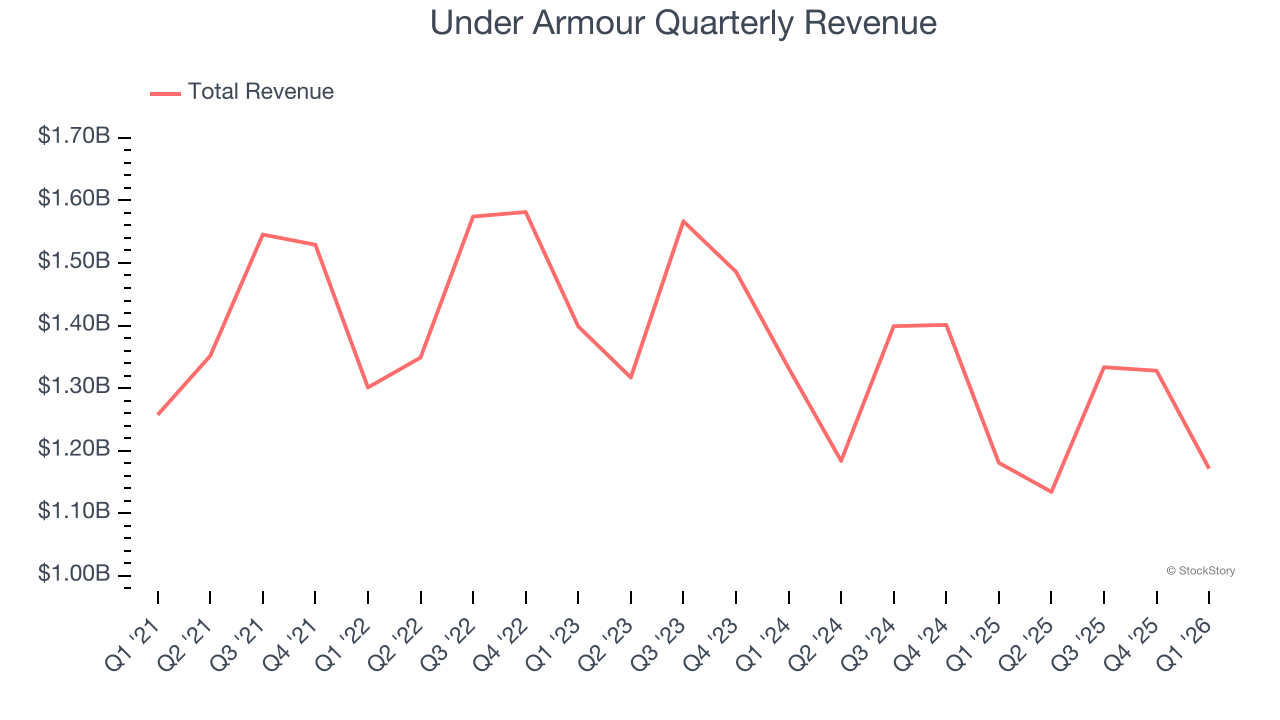
Long-term growth is the most important, but within consumer discretionary, product cycles are short and revenue can be hit-driven due to rapidly changing trends and consumer preferences. Under Armour’s recent performance shows its demand remained suppressed as its revenue has declined by 6.7% annually over the last two years. 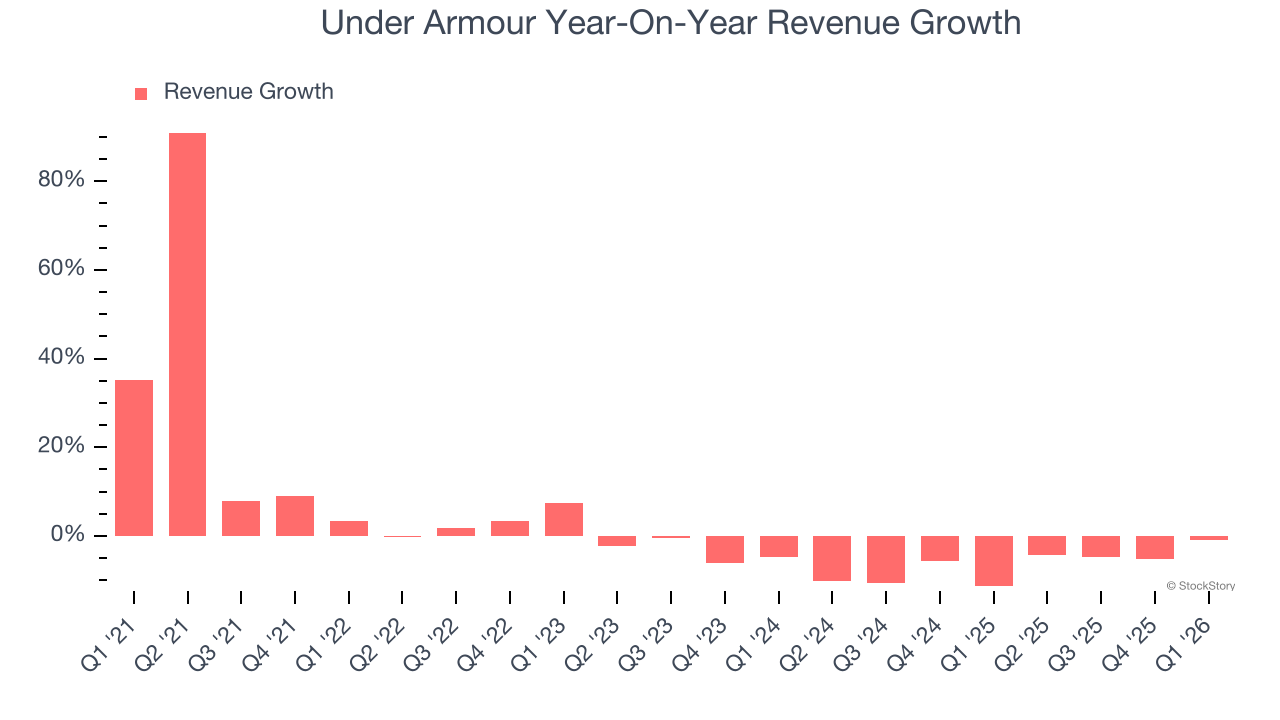
We can better understand the company’s sales dynamics by analyzing its constant currency revenue, which excludes currency movements that are outside their control and not indicative of demand. Over the last two years, its constant currency sales averaged 4.5% year-on-year declines. Because this number is better than its normal revenue growth, we can see that foreign exchange rates have been a headwind for Under Armour. 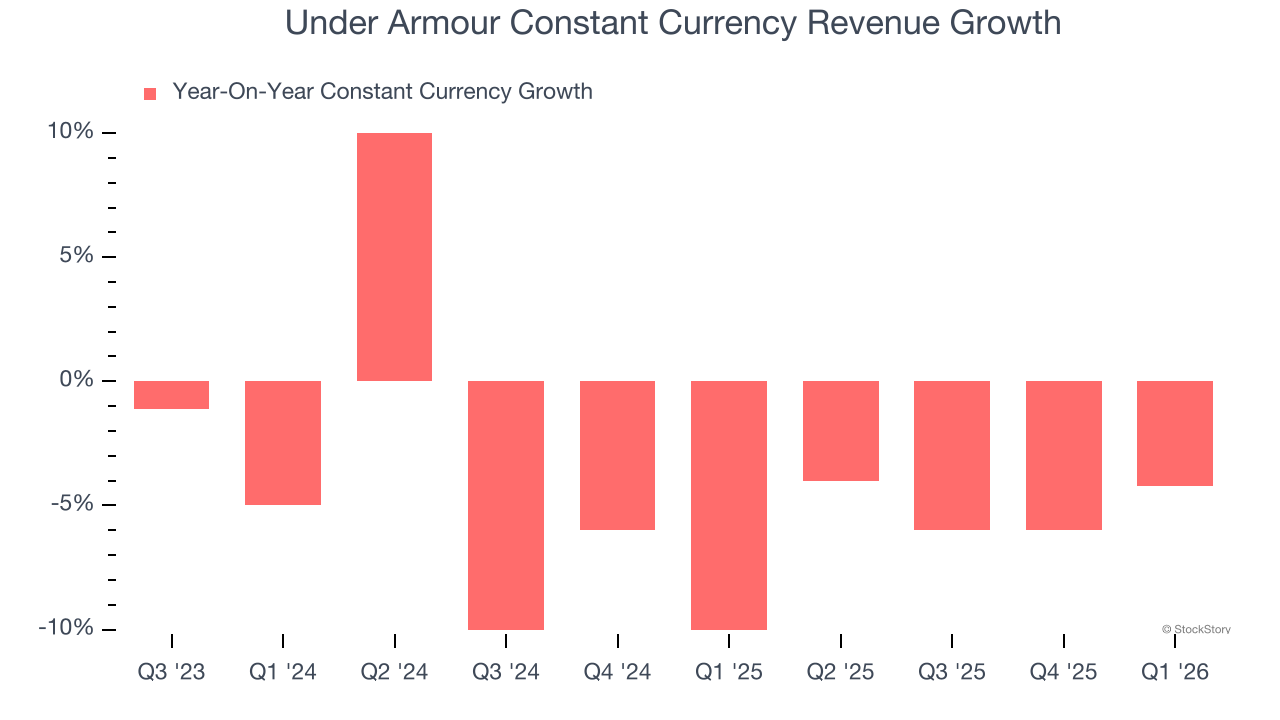
This quarter, Under Armour’s $1.17 billion of revenue was flat year on year and in line with Wall Street’s estimates.
Looking ahead, sell-side analysts expect revenue to grow 1.5% over the next 12 months. While this projection implies its newer products and services will spur better top-line performance, it is still below the sector average.
ALSO WORTH WATCHING: Nvidia’s Quiet Partner. Nvidia’s chips cost a hundred grand. The connectors that make them work cost even more. One company makes them all.
Every AI server needs specialized infrastructure the chip companies don’t make. High-speed cables. Power connectors. Thermal sensors. This 90-year-old company built a monopoly on it. The AI boom just started. This stock is still flying under the radar. Claim The Stock Ticker Here for FREE.
Operating Margin
Operating margin is an important measure of profitability as it shows the portion of revenue left after accounting for all core expenses – everything from the cost of goods sold to advertising and wages. It’s also useful for comparing profitability across companies with different levels of debt and tax rates because it excludes interest and taxes.
Under Armour’s operating margin has generally stayed the same over the last 12 months, averaging negative 3.4% over the last two years. Unprofitable consumer discretionary companies that fail to improve their losses or grow sales rapidly deserve extra scrutiny. For the time being, it’s unclear if Under Armour’s business model is sustainable.
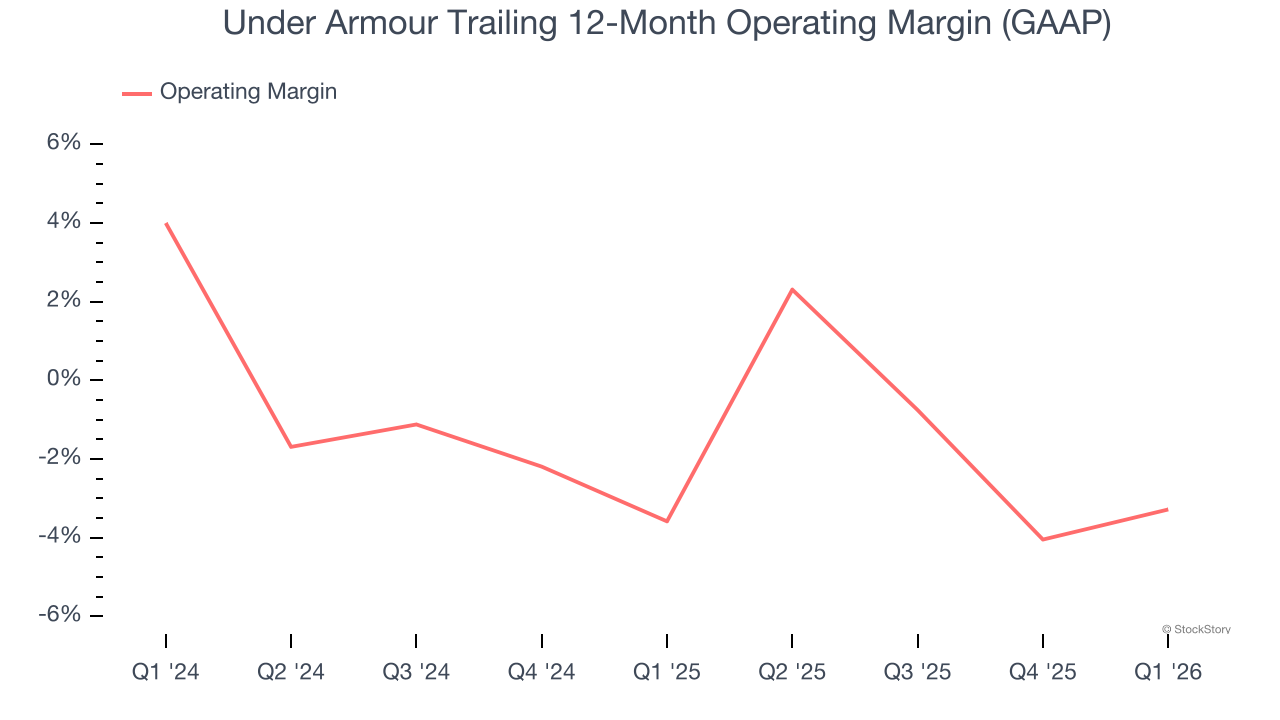
In Q1, Under Armour generated a negative 2.9% operating margin. The company's consistent lack of profits raise a flag.
Earnings Per Share
We track the long-term change in earnings per share (EPS) for the same reason as long-term revenue growth. Compared to revenue, however, EPS highlights whether a company’s growth is profitable.
Sadly for Under Armour, its EPS declined by 12.2% annually over the last five years while its revenue was flat. This tells us the company struggled because its fixed cost base made it difficult to adjust to choppy demand.
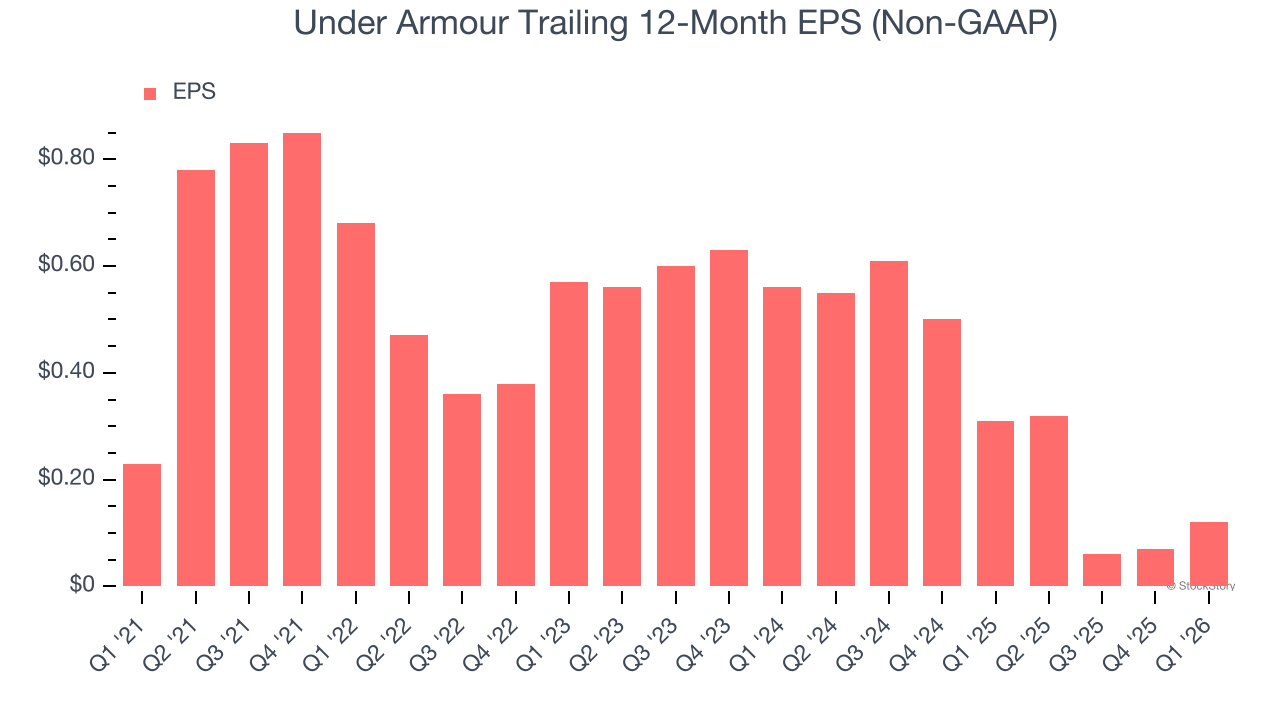
In Q1, Under Armour reported adjusted EPS of negative $0.03, up from negative $0.08 in the same quarter last year. Despite growing year on year, this print missed analysts’ estimates. Over the next 12 months, Wall Street expects Under Armour’s full-year EPS of $0.12 to grow 89.6%.
Key Takeaways from Under Armour’s Q1 Results
We struggled to find many positives in these results. Its full-year EPS guidance missed and its adjusted operating income fell short of Wall Street’s estimates. Overall, this was a softer quarter. The stock traded down 12.8% to $5.25 immediately following the results.
Under Armour’s earnings report left more to be desired. Let’s look forward to see if this quarter has created an opportunity to buy the stock. We think that the latest quarter is only one piece of the longer-term business quality puzzle. Quality, when combined with valuation, can help determine if the stock is a buy. We cover that in our actionable full research report which you can read here (it’s free).