
Electrical supply company WESCO (NYSE: WCC) reported Q1 CY2026 results beating Wall Street’s revenue expectations, with sales up 13.8% year on year to $6.08 billion. Its non-GAAP profit of $3.37 per share was 18.9% above analysts’ consensus estimates.
Is now the time to buy WESCO? Find out by accessing our full research report, it’s free.
WESCO (WCC) Q1 CY2026 Highlights:
- Revenue: $6.08 billion vs analyst estimates of $5.86 billion (13.8% year-on-year growth, 3.7% beat)
- Adjusted EPS: $3.37 vs analyst estimates of $2.83 (18.9% beat)
- Adjusted EBITDA: $388.8 million vs analyst estimates of $363.7 million (6.4% margin, 6.9% beat)
- Operating Margin: 4.8%, in line with the same quarter last year
- Free Cash Flow Margin: 3.3%, up from 0.2% in the same quarter last year
- Organic Revenue rose 12.3% year on year (beat)
- Market Capitalization: $14.88 billion
"We delivered an exceptional start to 2026, building on last year's market outperformance and accelerating business momentum. Sales, backlog, operating margin, adjusted earnings per share, and free cash flow all increased versus the prior year and exceeded our expectations. Record sales of $6.1 billion were up 14% marking our third quarter in a row of double-digit sales growth. Data center sales of $1.4 billion were up approximately 70% and now represent 24% of our total Wesco sales. Backlog was up 22%, to a new record level, reflecting the benefits of secular growth trends and continued effectiveness of our cross-selling program. Profit growth and margin improvement were also excellent, driven by gross margin expansion and strong operating cost leverage. As a result, we delivered adjusted EBITDA margin expansion of 60 basis points, adjusted EBITDA growth of 25%, and adjusted EPS growth of over 50% versus the prior year. Free cash flow generation, at 128% of adjusted net income, was also very strong. The power of our customer value proposition, global capabilities, and leading portfolio of products, services and solutions is clear as we continue to outperform the market," said John Engel, Chairman, President, and CEO.
Company Overview
Based in Pittsburgh, WESCO (NYSE: WCC) provides electrical, industrial, and communications products and augments them with services such as supply chain management.
Revenue Growth
A company’s long-term sales performance is one signal of its overall quality. Any business can have short-term success, but a top-tier one grows for years. Thankfully, WESCO’s 11% annualized revenue growth over the last five years was impressive. Its growth beat the average industrials company and shows its offerings resonate with customers.
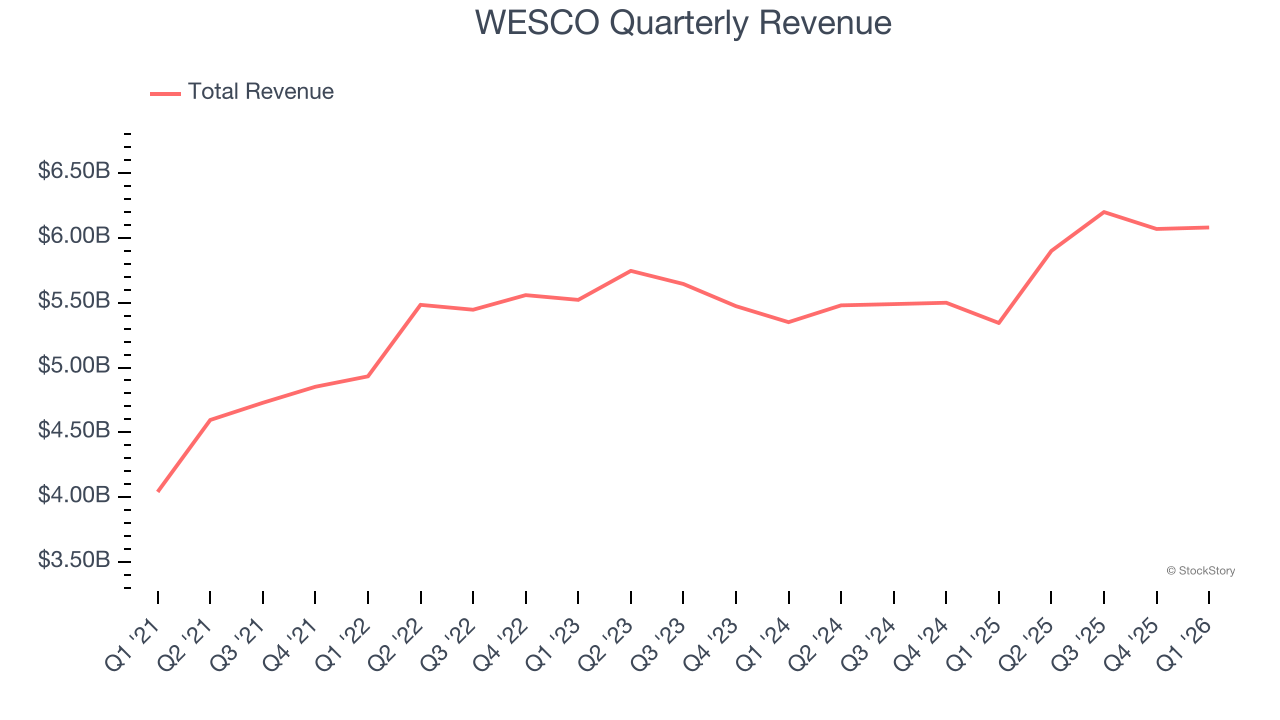
We at StockStory place the most emphasis on long-term growth, but within industrials, a half-decade historical view may miss cycles, industry trends, or a company capitalizing on catalysts such as a new contract win or a successful product line. WESCO’s recent performance shows its demand has slowed significantly as its annualized revenue growth of 4.5% over the last two years was well below its five-year trend. 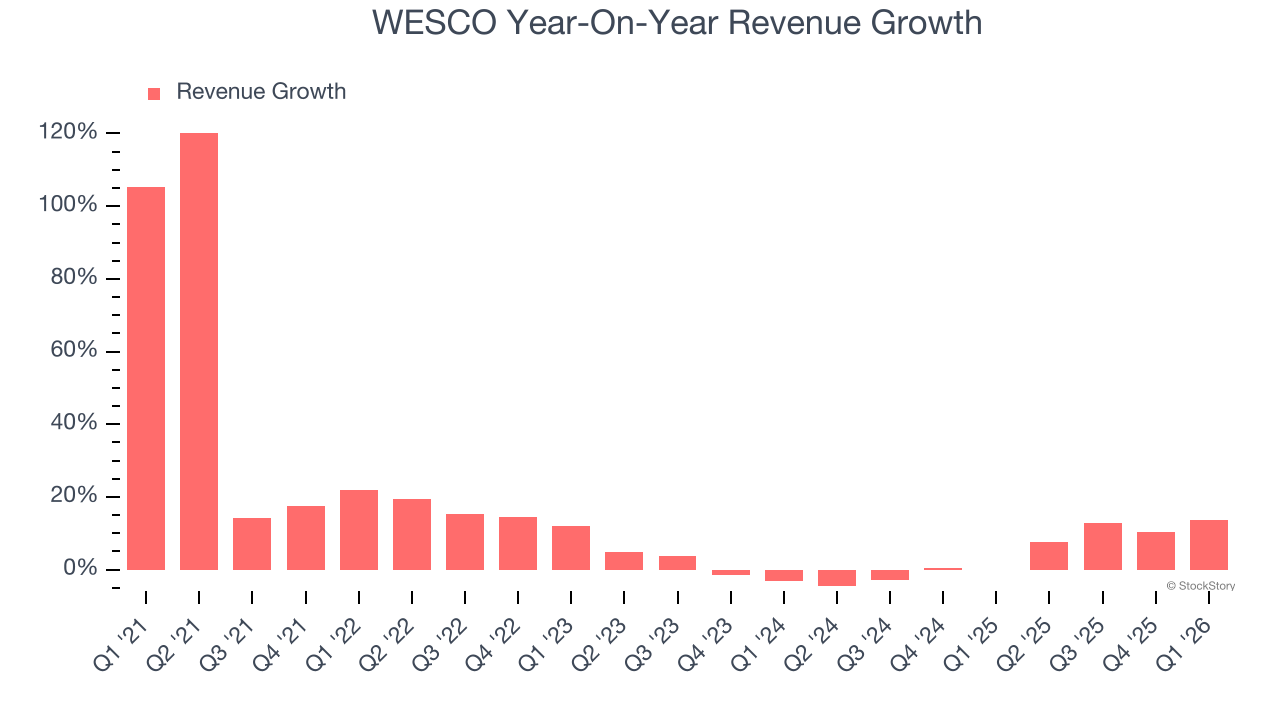
WESCO also reports organic revenue, which strips out one-time events like acquisitions and currency fluctuations that don’t accurately reflect its fundamentals. Over the last two years, WESCO’s organic revenue averaged 5.9% year-on-year growth. Because this number aligns with its two-year revenue growth, we can see the company’s core operations (not acquisitions and divestitures) drove most of its results. 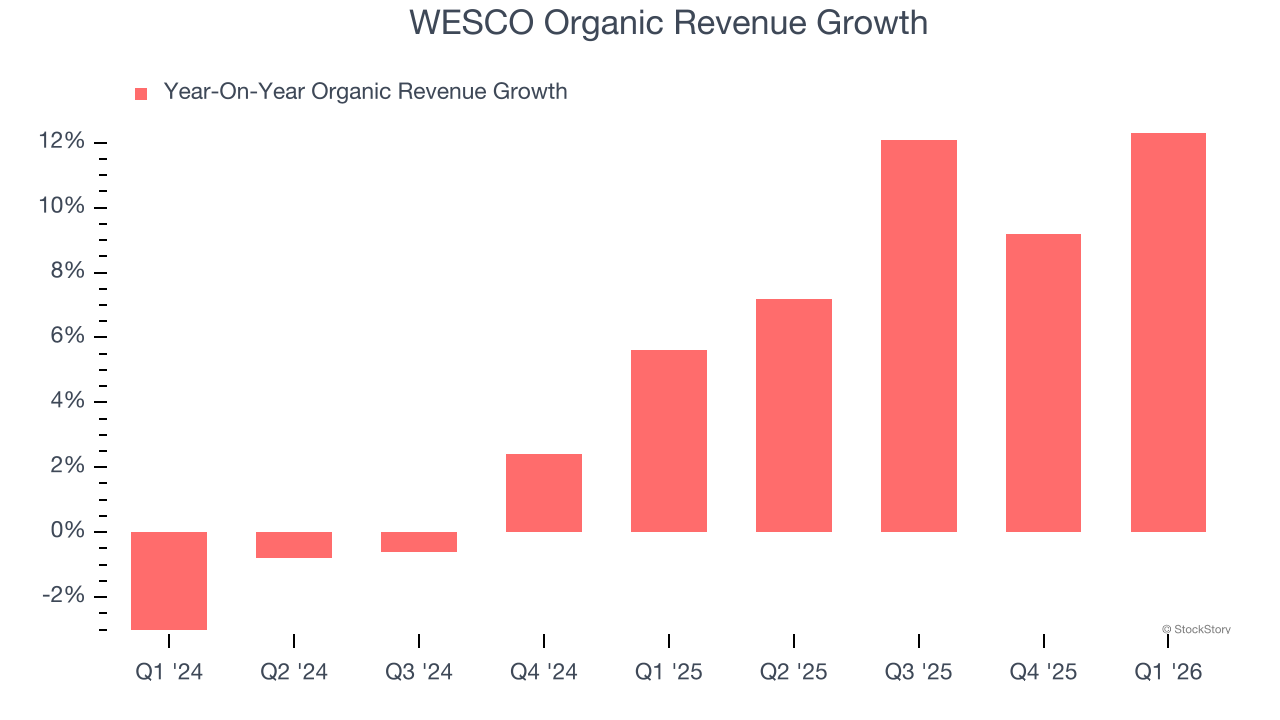
This quarter, WESCO reported year-on-year revenue growth of 13.8%, and its $6.08 billion of revenue exceeded Wall Street’s estimates by 3.7%.
Looking ahead, sell-side analysts expect revenue to grow 5.1% over the next 12 months, similar to its two-year rate. This projection doesn't excite us and indicates its newer products and services will not catalyze better top-line performance yet.
ALSO WORTH WATCHING: Nvidia’s Quiet Partner. Nvidia’s chips cost a hundred grand. The connectors that make them work cost even more. One company makes them all.
Every AI server needs specialized infrastructure the chip companies don’t make. High-speed cables. Power connectors. Thermal sensors. This 90-year-old company built a monopoly on it. The AI boom just started. This stock is still flying under the radar. Claim The Stock Ticker Here for FREE.
Operating Margin
Operating margin is a key measure of profitability. Think of it as net income - the bottom line - excluding the impact of taxes and interest on debt, which are less connected to business fundamentals.
WESCO’s operating margin has more or less stayed the same over the last 12 months , averaging 5.7% over the last five years. This profitability was paltry for an industrials business and caused by its suboptimal cost structureand low gross margin.
Analyzing the trend in its profitability, WESCO’s operating margin might fluctuated slightly but has generally stayed the same over the last five years. This raises questions about the company’s expense base because its revenue growth should have given it leverage on its fixed costs, resulting in better economies of scale and profitability.
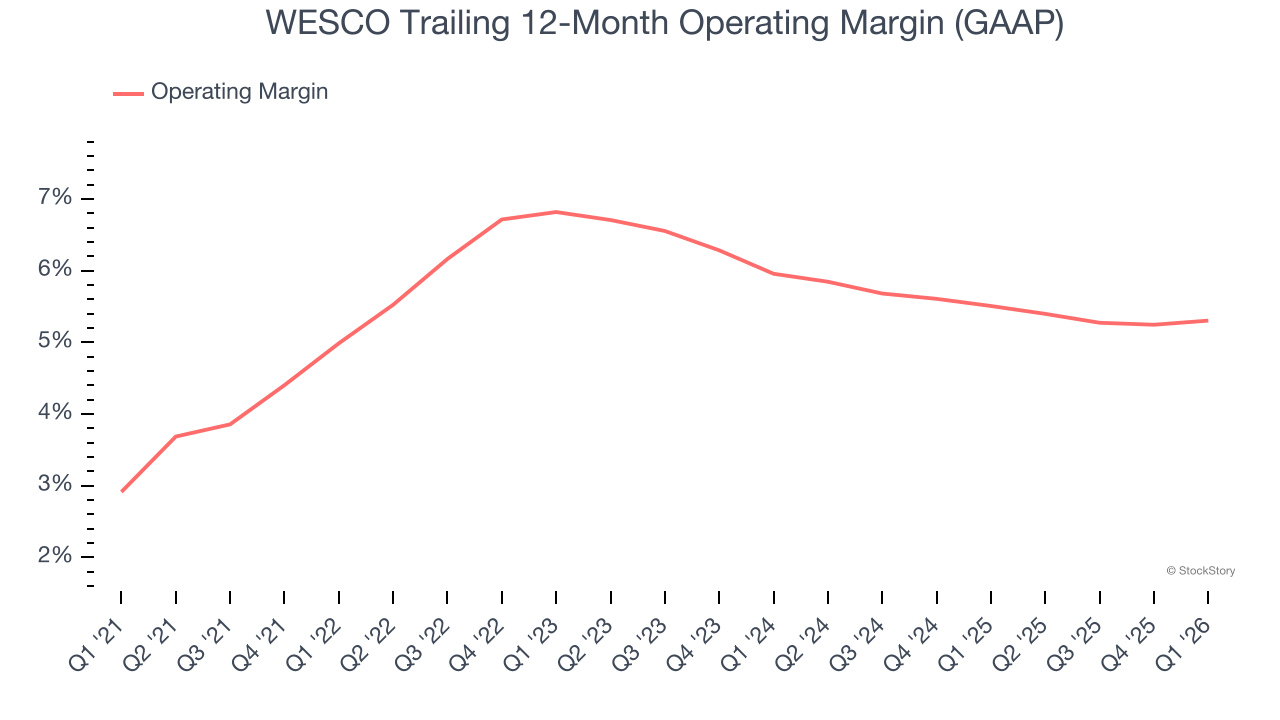
In Q1, WESCO generated an operating margin profit margin of 4.8%, in line with the same quarter last year. This indicates the company’s cost structure has recently been stable.
Earnings Per Share
Revenue trends explain a company’s historical growth, but the long-term change in earnings per share (EPS) points to the profitability of that growth – for example, a company could inflate its sales through excessive spending on advertising and promotions.
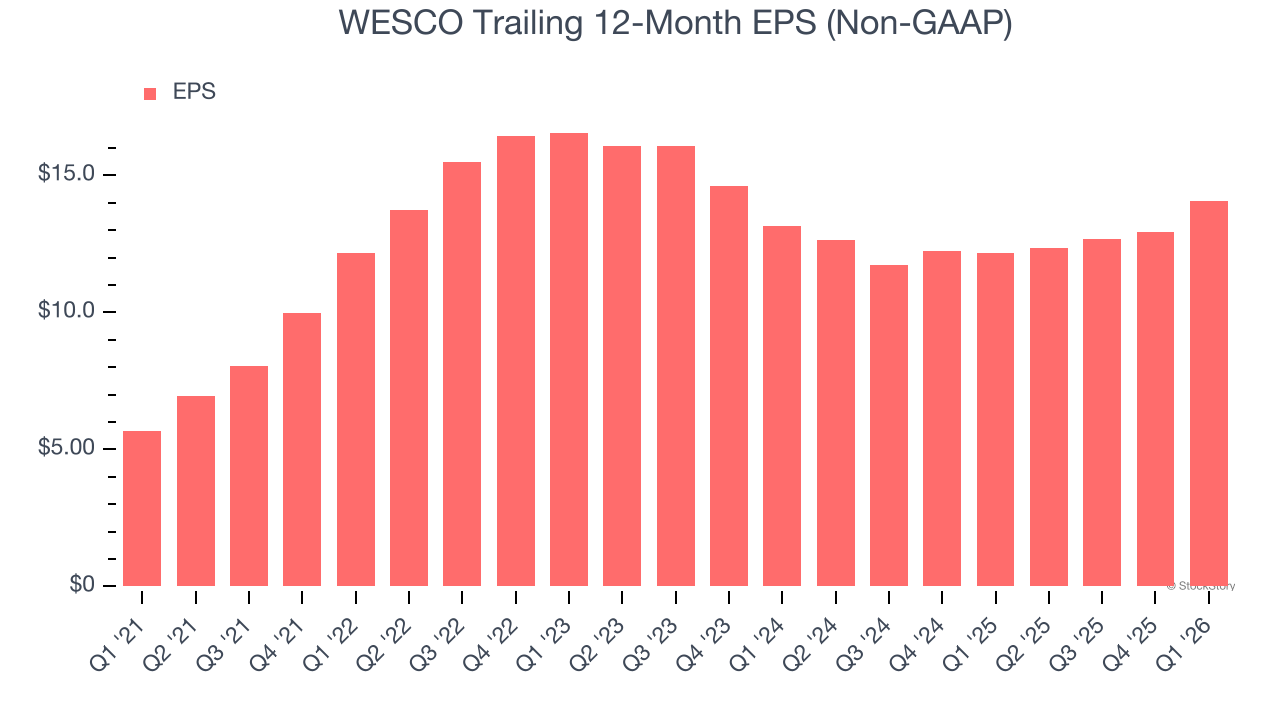
WESCO’s EPS grew at 20% compounded annual growth rate over the last five years, higher than its 11% annualized revenue growth. This tells us the company became more profitable on a per-share basis as it expanded.
We can take a deeper look into WESCO’s earnings to better understand the drivers of its performance. A five-year view shows that WESCO has repurchased its stock, shrinking its share count by 4.3%. This tells us its EPS outperformed its revenue not because of increased operational efficiency but financial engineering, as buybacks boost per share earnings. 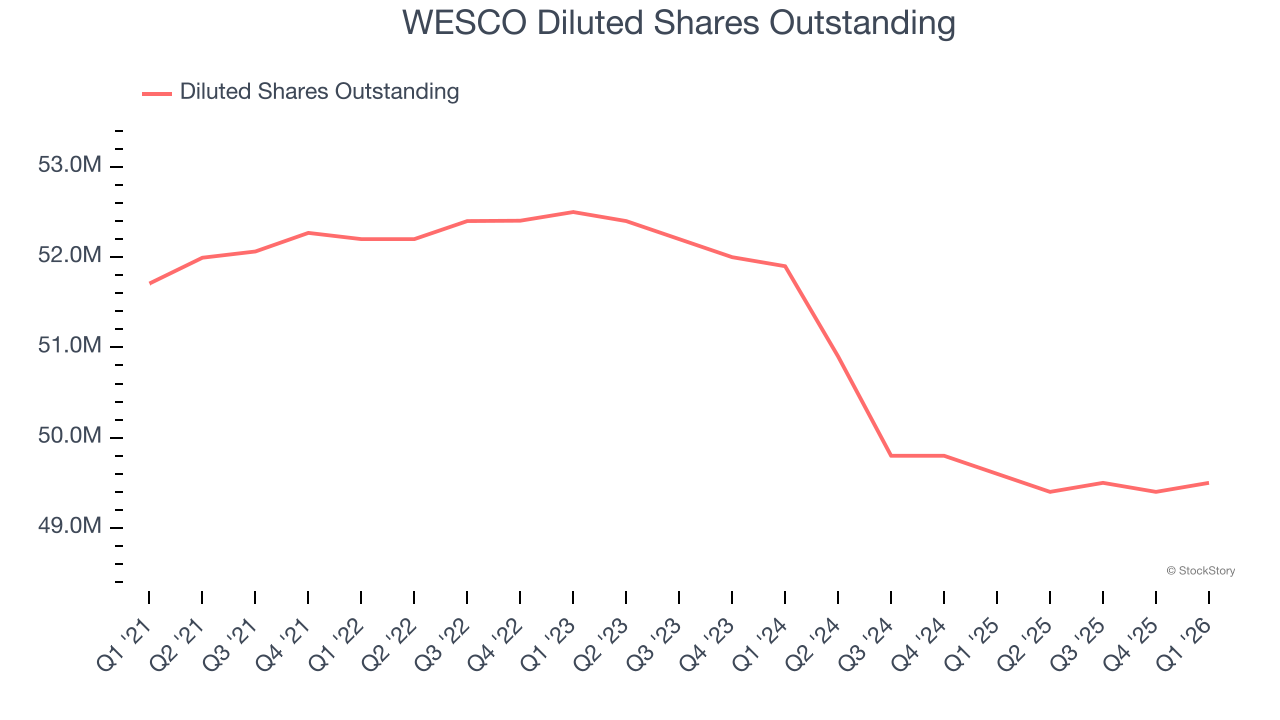
Like with revenue, we analyze EPS over a shorter period to see if we are missing a change in the business.
For WESCO, its two-year annual EPS growth of 3.5% was lower than its five-year trend. We hope its growth can accelerate in the future.
In Q1, WESCO reported adjusted EPS of $3.37, up from $2.21 in the same quarter last year. This print easily cleared analysts’ estimates, and shareholders should be content with the results. Over the next 12 months, Wall Street expects WESCO’s full-year EPS of $14.08 to grow 16%.
Key Takeaways from WESCO’s Q1 Results
We were impressed by how significantly WESCO blew past analysts’ organic revenue expectations this quarter. We were also excited its revenue outperformed Wall Street’s estimates by a wide margin. Zooming out, we think this was a solid print. The stock traded up 21.4% to $370.73 immediately following the results.
WESCO put up rock-solid earnings, but one quarter doesn’t necessarily make the stock a buy. Let’s see if this is a good investment. The latest quarter does matter, but not nearly as much as longer-term fundamentals and valuation, when deciding if the stock is a buy. We cover that in our actionable full research report which you can read here (it’s free).