Electrical and electronic products company Hubbell (NYSE: HUBB) met Wall Streets revenue expectations in Q4 CY2025, with sales up 11.9% year on year to $1.49 billion. Its non-GAAP profit of $4.73 per share was in line with analysts’ consensus estimates.
Is now the time to buy Hubbell? Find out by accessing our full research report, it’s free.
Hubbell (HUBB) Q4 CY2025 Highlights:
- Revenue: $1.49 billion vs analyst estimates of $1.49 billion (11.9% year-on-year growth, in line)
- Adjusted EPS: $4.73 vs analyst estimates of $4.72 (in line)
- Adjusted EBITDA: $373 million vs analyst estimates of $369.2 million (25% margin, 1% beat)
- Adjusted EPS guidance for the upcoming financial year 2026 is $19.50 at the midpoint, missing analyst estimates by 1.6%
- Operating Margin: 20.9%, up from 19.5% in the same quarter last year
- Free Cash Flow Margin: 26%, down from 27.3% in the same quarter last year
- Organic Revenue rose 8.9% year on year (beat)
- Market Capitalization: $26.34 billion
“Hubbell delivered double-digit growth in net sales, operating profit and diluted earnings per share in the fourth quarter" said Gerben Bakker, Chairman, President and CEO.
Company Overview
A respected player in the electrical segment, Hubbell (NYSE: HUBB) manufactures electronic products for the construction, industrial, utility, and telecommunications markets.
Revenue Growth
Reviewing a company’s long-term sales performance reveals insights into its quality. Even a bad business can shine for one or two quarters, but a top-tier one grows for years. Luckily, Hubbell’s sales grew at a solid 9.7% compounded annual growth rate over the last five years. Its growth surpassed the average industrials company and shows its offerings resonate with customers, a great starting point for our analysis.
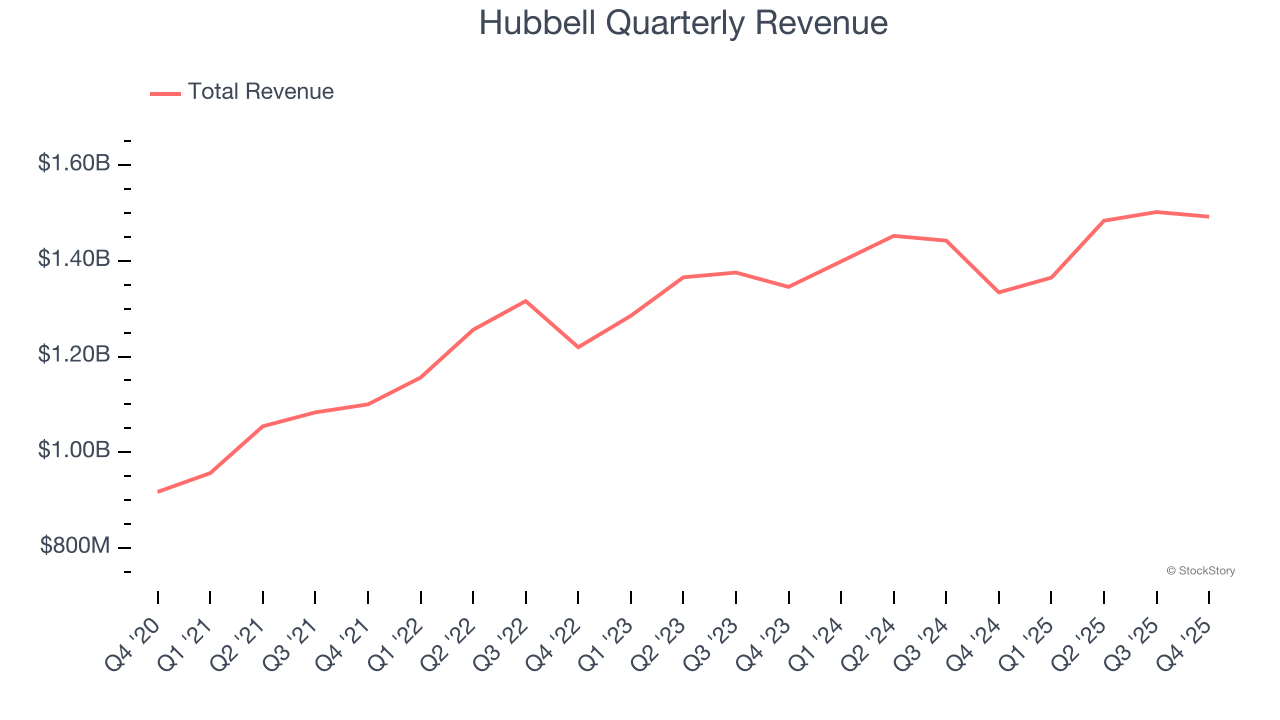
Long-term growth is the most important, but within industrials, a half-decade historical view may miss new industry trends or demand cycles. Hubbell’s recent performance shows its demand has slowed as its annualized revenue growth of 4.3% over the last two years was below its five-year trend. 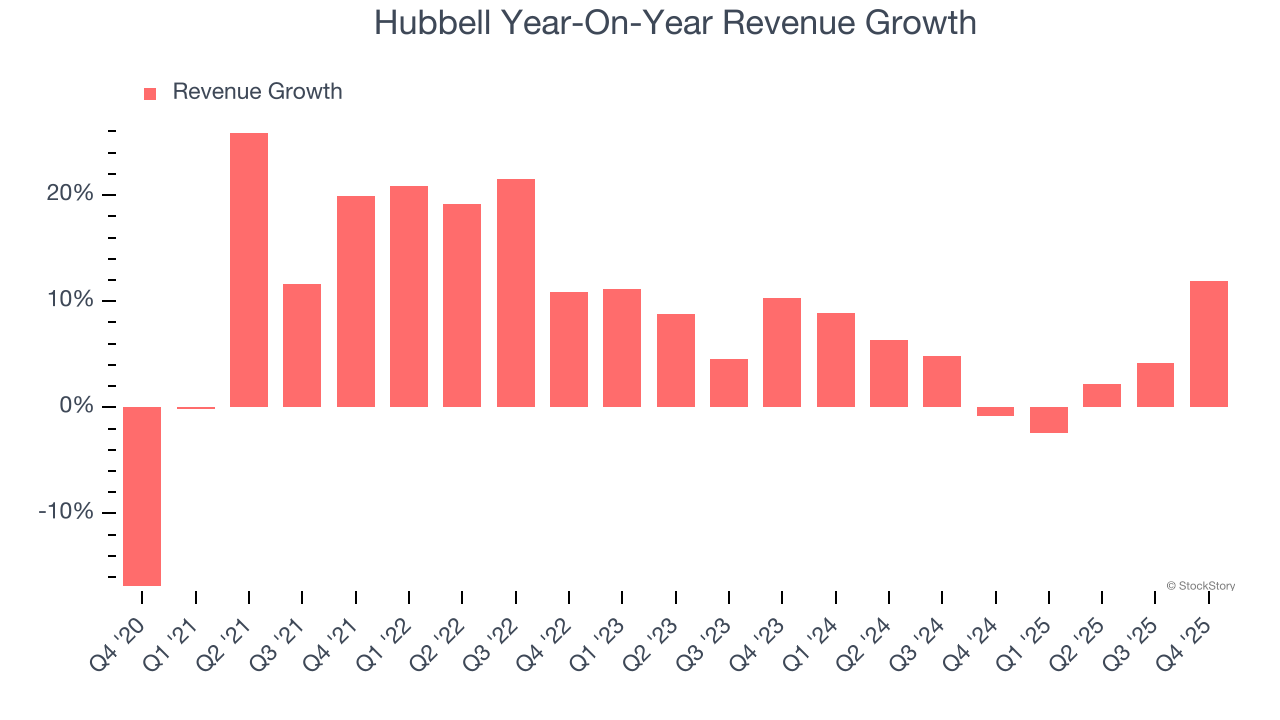
We can better understand the company’s sales dynamics by analyzing its organic revenue, which strips out one-time events like acquisitions and currency fluctuations that don’t accurately reflect its fundamentals. Over the last two years, Hubbell’s organic revenue averaged 1.7% year-on-year growth. Because this number is lower than its two-year revenue growth, we can see that some mixture of acquisitions and foreign exchange rates boosted its headline results. 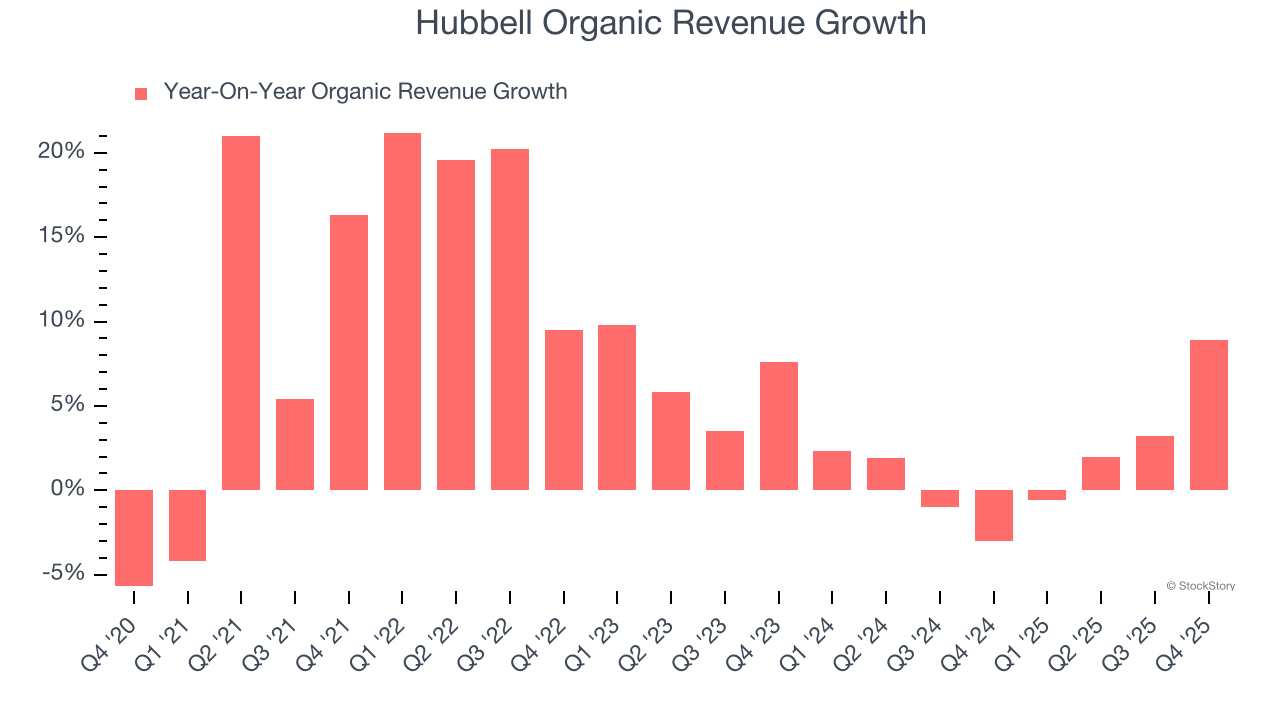
This quarter, Hubbell’s year-on-year revenue growth was 11.9%, and its $1.49 billion of revenue was in line with Wall Street’s estimates.
Looking ahead, sell-side analysts expect revenue to grow 7.8% over the next 12 months, an improvement versus the last two years. This projection is above average for the sector and indicates its newer products and services will fuel better top-line performance.
Microsoft, Alphabet, Coca-Cola, Monster Beverage—all began as under-the-radar growth stories riding a massive trend. We’ve identified the next one: a profitable AI semiconductor play Wall Street is still overlooking. Go here for access to our full report.
Operating Margin
Operating margin is a key measure of profitability. Think of it as net income - the bottom line - excluding the impact of taxes and interest on debt, which are less connected to business fundamentals.
Hubbell has been a well-oiled machine over the last five years. It demonstrated elite profitability for an industrials business, boasting an average operating margin of 17.6%.
Analyzing the trend in its profitability, Hubbell’s operating margin rose by 8 percentage points over the last five years, as its sales growth gave it immense operating leverage.
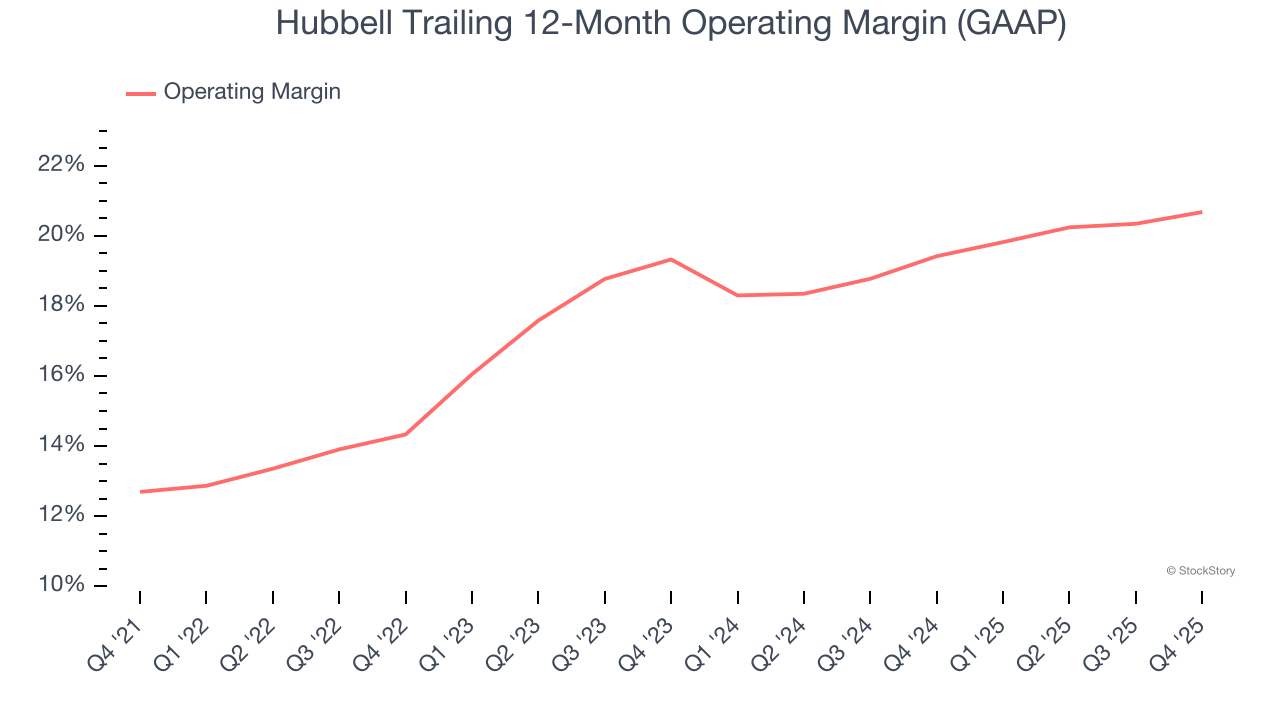
In Q4, Hubbell generated an operating margin profit margin of 20.9%, up 1.4 percentage points year on year. The increase was encouraging, and because its operating margin rose more than its gross margin, we can infer it was more efficient with expenses such as marketing, R&D, and administrative overhead.
Earnings Per Share
We track the long-term change in earnings per share (EPS) for the same reason as long-term revenue growth. Compared to revenue, however, EPS highlights whether a company’s growth is profitable.
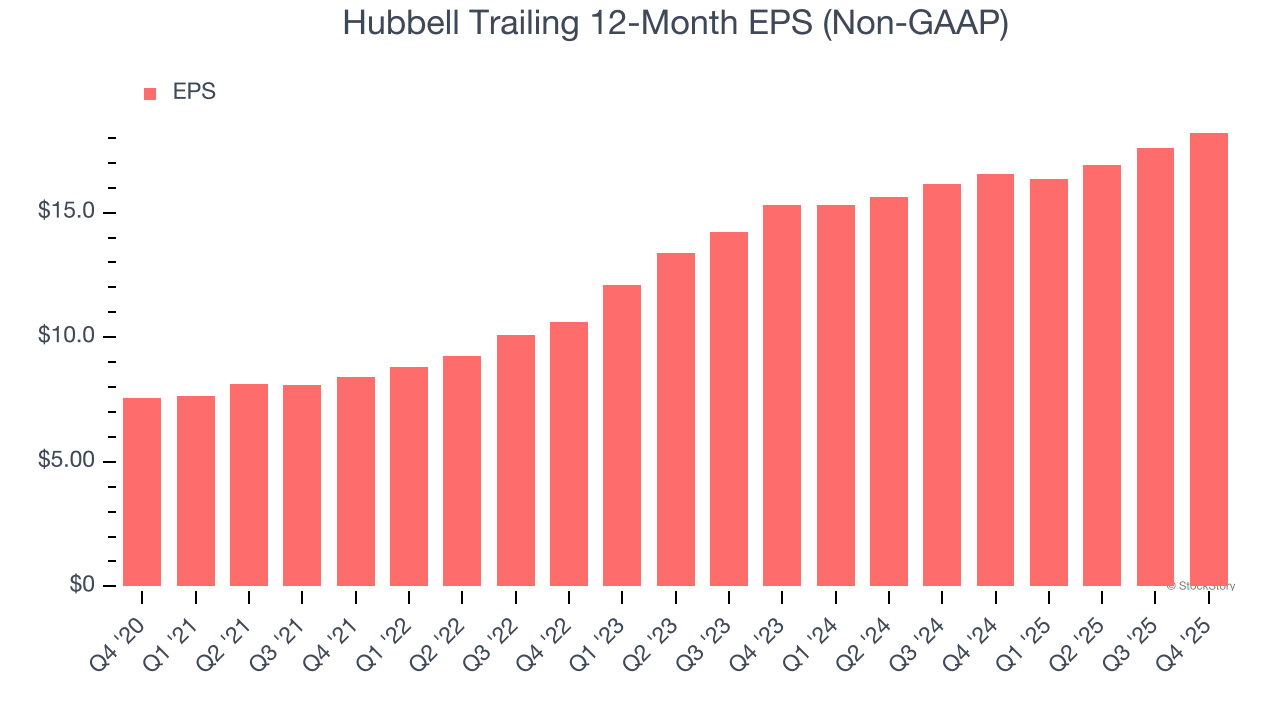
Hubbell’s EPS grew at an astounding 19.2% compounded annual growth rate over the last five years, higher than its 9.7% annualized revenue growth. This tells us the company became more profitable on a per-share basis as it expanded.
Diving into Hubbell’s quality of earnings can give us a better understanding of its performance. As we mentioned earlier, Hubbell’s operating margin expanded by 8 percentage points over the last five years. This was the most relevant factor (aside from the revenue impact) behind its higher earnings; interest expenses and taxes can also affect EPS but don’t tell us as much about a company’s fundamentals.
Like with revenue, we analyze EPS over a more recent period because it can provide insight into an emerging theme or development for the business.
For Hubbell, its two-year annual EPS growth of 9% was lower than its five-year trend. This wasn’t great, but at least the company was successful in other measures of financial health.
In Q4, Hubbell reported adjusted EPS of $4.73, up from $4.10 in the same quarter last year. This print was close to analysts’ estimates. Over the next 12 months, Wall Street expects Hubbell’s full-year EPS of $18.21 to grow 8.8%.
Key Takeaways from Hubbell’s Q4 Results
Revenue and EPS were just in line, and full-year EPS guidance missed. Overall, this was a weaker quarter without any major positive surprises. The stock remained flat at $498 immediately following the results.
Should you buy the stock or not? We think that the latest quarter is only one piece of the longer-term business quality puzzle. Quality, when combined with valuation, can help determine if the stock is a buy. We cover that in our actionable full research report which you can read here (it’s free).