
Research and advisory firm Gartner (NYSE: IT) met Wall Streets revenue expectations in Q4 CY2025, with sales up 2.2% year on year to $1.75 billion. Its GAAP profit of $3.36 per share was 4.9% above analysts’ consensus estimates.
Is now the time to buy Gartner? Find out by accessing our full research report, it’s free.
Gartner (IT) Q4 CY2025 Highlights:
- Revenue: $1.75 billion vs analyst estimates of $1.75 billion (2.2% year-on-year growth, in line)
- EPS (GAAP): $3.36 vs analyst estimates of $3.20 (4.9% beat)
- Adjusted EBITDA: $436 million vs analyst estimates of $415.1 million (24.9% margin, 5% beat)
- Operating Margin: 19.1%, in line with the same quarter last year
- Free Cash Flow Margin: 15.5%, down from 18.2% in the same quarter last year
- Market Capitalization: $14.59 billion
Gene Hall, Gartner’s Chairman and Chief Executive Officer, commented, “Fourth quarter financial results were ahead of expectations. We repurchased $2 billion of Gartner stock in 2025. Over the past few months, we increased our leverage through the successful completion of our first investment-grade bond issuance, we entered into a definitive agreement to divest the Digital Markets business, and the Board appointed two new directors who bring unique and valuable skills. Looking ahead, we expect CV to accelerate throughout 2026.”
Company Overview
With over 2,500 research experts guiding organizations through complex technology landscapes, Gartner (NYSE: IT) provides research, advisory services, and conferences that help executives make better decisions about technology and other business priorities.
Revenue Growth
Examining a company’s long-term performance can provide clues about its quality. Any business can experience short-term success, but top-performing ones enjoy sustained growth for years.
With $6.50 billion in revenue over the past 12 months, Gartner is one of the larger companies in the business services industry and benefits from a well-known brand that influences purchasing decisions.
As you can see below, Gartner’s 9.6% annualized revenue growth over the last five years was impressive. This shows it had high demand, a useful starting point for our analysis.
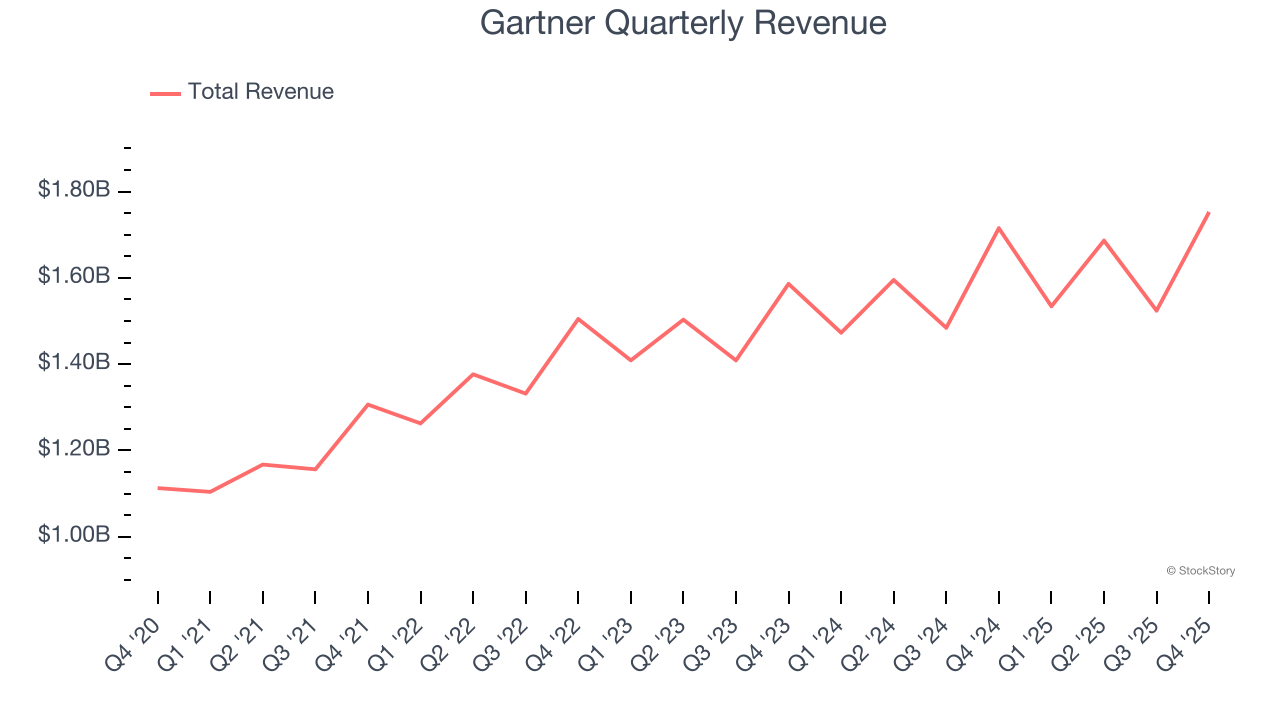
Long-term growth is the most important, but within business services, a half-decade historical view may miss new innovations or demand cycles. Gartner’s recent performance shows its demand has slowed significantly as its annualized revenue growth of 4.9% over the last two years was well below its five-year trend. 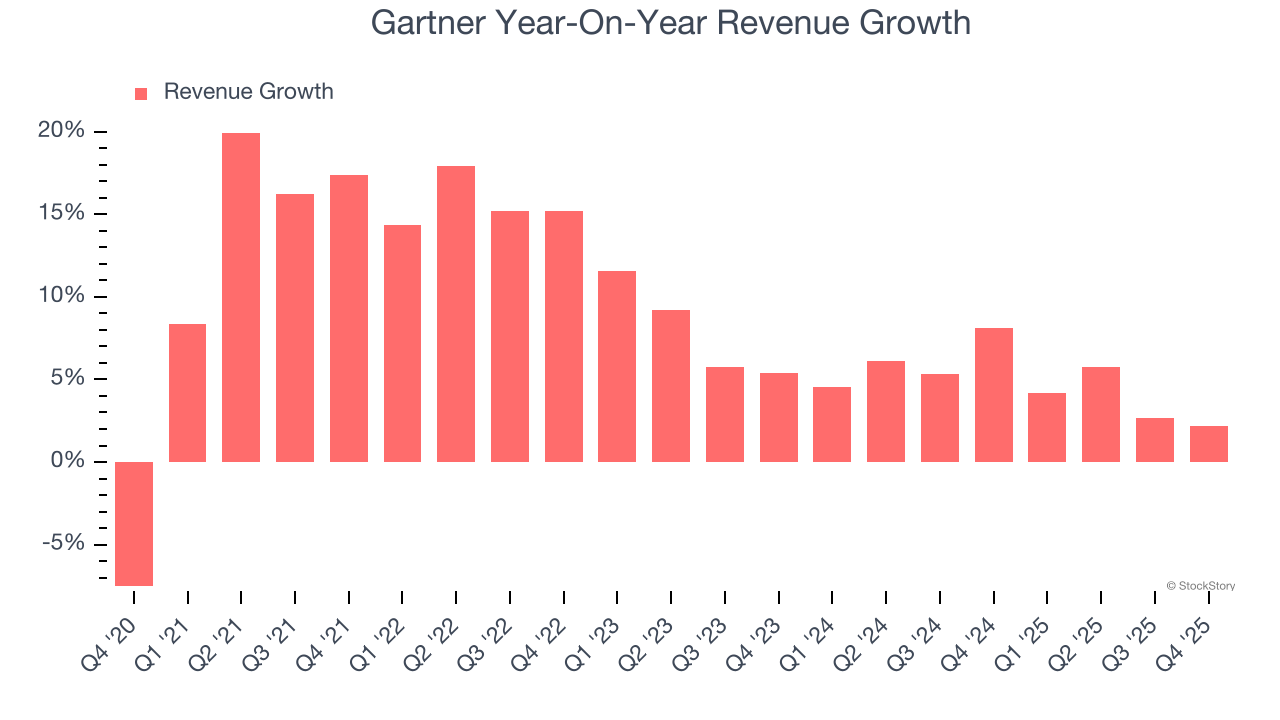
This quarter, Gartner grew its revenue by 2.2% year on year, and its $1.75 billion of revenue was in line with Wall Street’s estimates.
Looking ahead, sell-side analysts expect revenue to grow 3.4% over the next 12 months, similar to its two-year rate. This projection is underwhelming and implies its products and services will face some demand challenges.
Microsoft, Alphabet, Coca-Cola, Monster Beverage—all began as under-the-radar growth stories riding a massive trend. We’ve identified the next one: a profitable AI semiconductor play Wall Street is still overlooking. Go here for access to our full report.
Operating Margin
Gartner has been a well-oiled machine over the last five years. It demonstrated elite profitability for a business services business, boasting an average operating margin of 18.8%.
Looking at the trend in its profitability, Gartner’s operating margin decreased by 3.6 percentage points over the last five years. This raises questions about the company’s expense base because its revenue growth should have given it leverage on its fixed costs, resulting in better economies of scale and profitability.
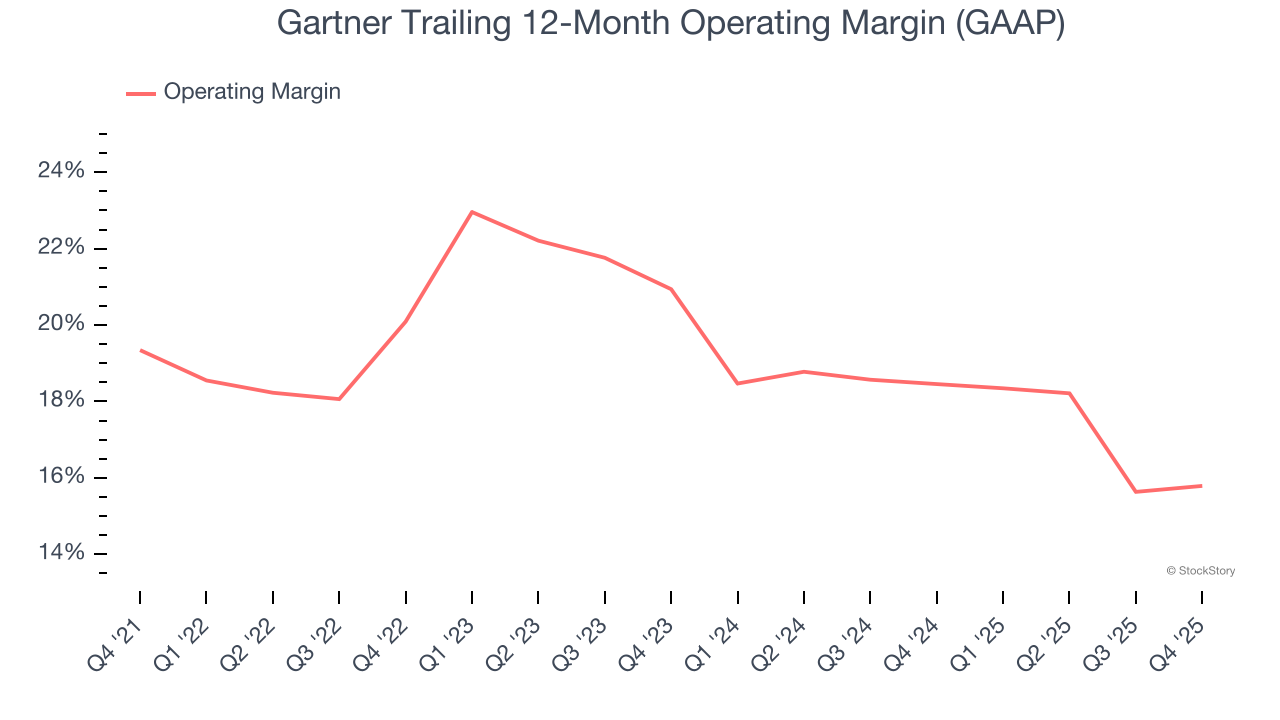
In Q4, Gartner generated an operating margin profit margin of 19.1%, in line with the same quarter last year. This indicates the company’s overall cost structure has been relatively stable.
Earnings Per Share
Revenue trends explain a company’s historical growth, but the long-term change in earnings per share (EPS) points to the profitability of that growth – for example, a company could inflate its sales through excessive spending on advertising and promotions.
Gartner’s EPS grew at an astounding 26.7% compounded annual growth rate over the last five years, higher than its 9.6% annualized revenue growth. This tells us the company became more profitable on a per-share basis as it expanded.
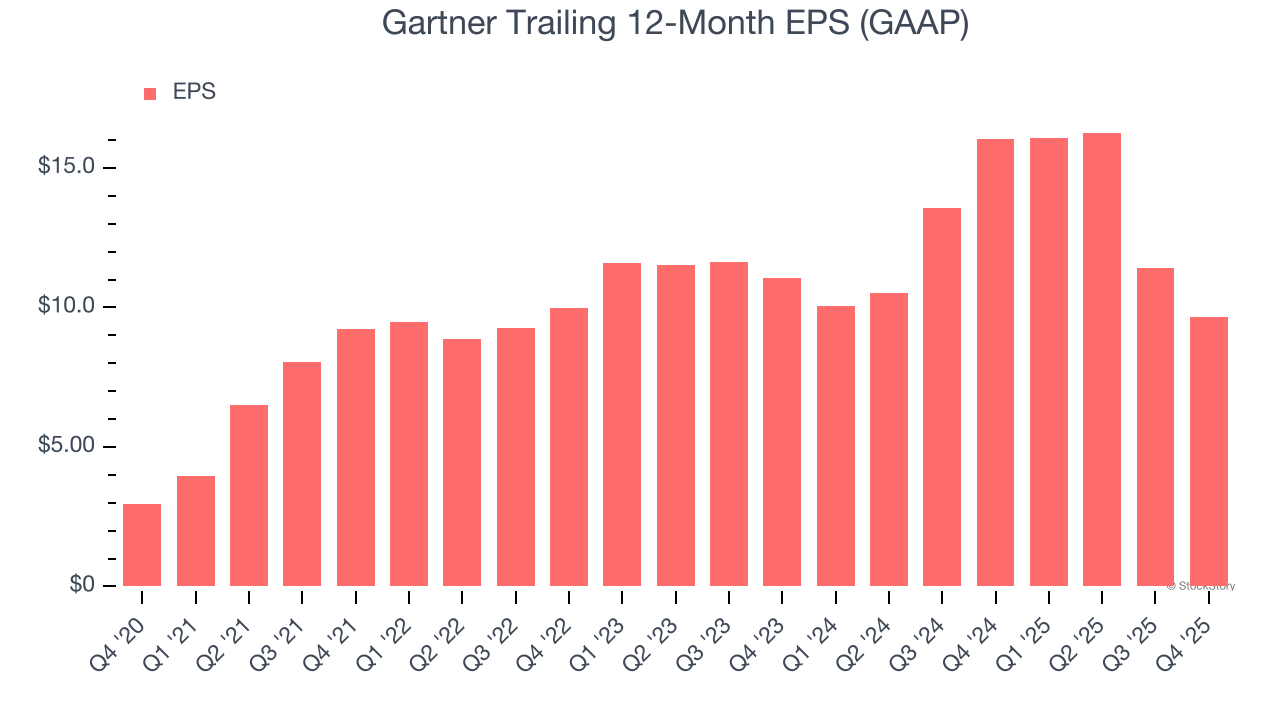
Diving into Gartner’s quality of earnings can give us a better understanding of its performance. A five-year view shows that Gartner has repurchased its stock, shrinking its share count by 20%. This tells us its EPS outperformed its revenue not because of increased operational efficiency but financial engineering, as buybacks boost per share earnings. 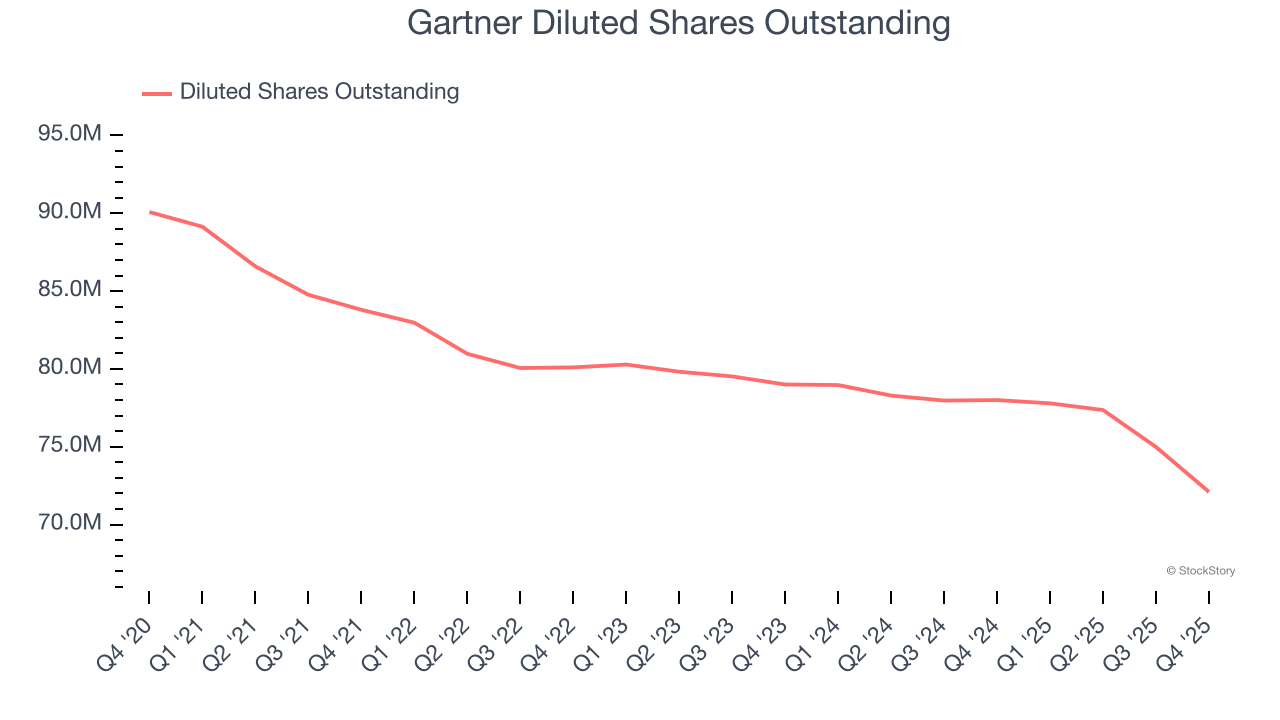
Like with revenue, we analyze EPS over a shorter period to see if we are missing a change in the business.
For Gartner, its two-year annual EPS declines of 6.6% mark a reversal from its (seemingly) healthy five-year trend. These shorter-term results weren’t ideal, but given it was successful in other measures of financial health, we’re hopeful Gartner can return to earnings growth in the future.
In Q4, Gartner reported EPS of $3.36, down from $5.12 in the same quarter last year. Despite falling year on year, this print beat analysts’ estimates by 4.9%. Over the next 12 months, Wall Street expects Gartner’s full-year EPS of $9.66 to grow 28.1%.
Key Takeaways from Gartner’s Q4 Results
It was good to see Gartner beat analysts’ EPS expectations this quarter. Overall, this print had some key positives. Investors were likely hoping for more, and shares traded down 2.3% to $197.69 immediately following the results.
Is Gartner an attractive investment opportunity at the current price? When making that decision, it’s important to consider its valuation, business qualities, as well as what has happened in the latest quarter. We cover that in our actionable full research report which you can read here (it’s free).