Packaging manufacturer Ball (NYSE: BLL) reported revenue ahead of Wall Streets expectations in Q4 CY2025, with sales up 16.2% year on year to $3.35 billion. Its non-GAAP profit of $0.91 per share was 1.5% above analysts’ consensus estimates.
Is now the time to buy Ball? Find out by accessing our full research report, it’s free.
Ball (BALL) Q4 CY2025 Highlights:
- Revenue: $3.35 billion vs analyst estimates of $3.12 billion (16.2% year-on-year growth, 7.3% beat)
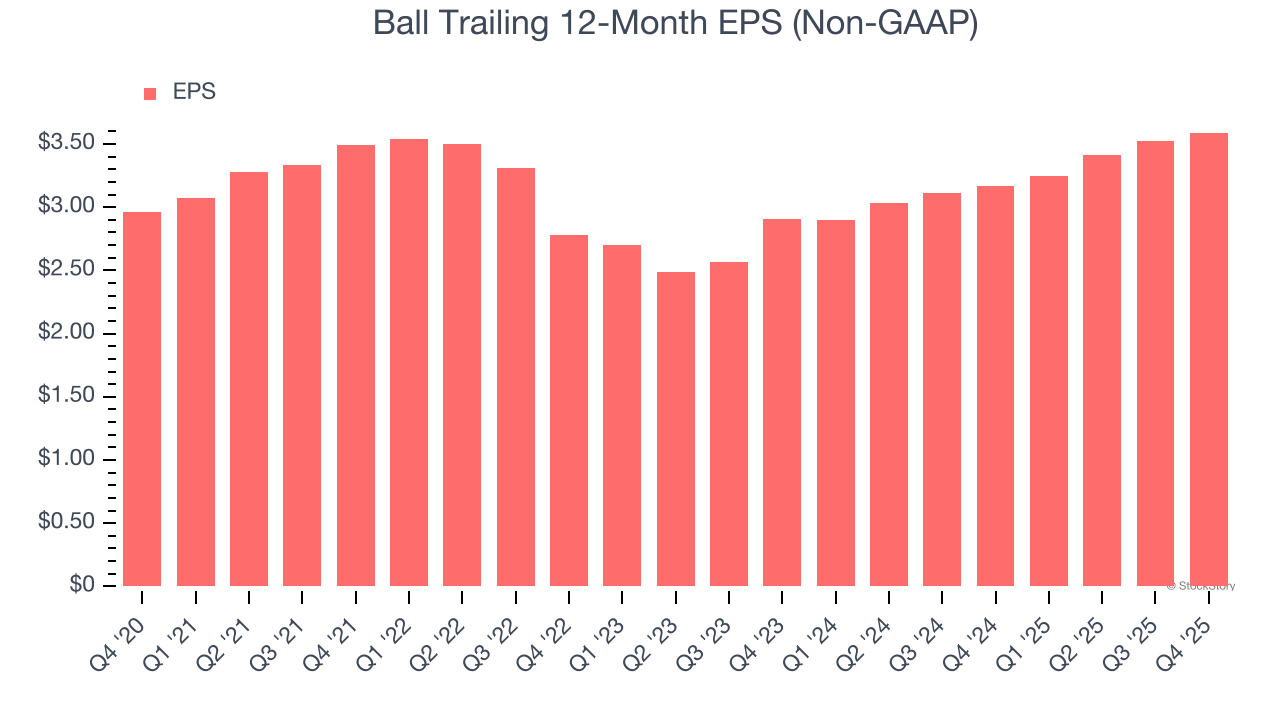
- Adjusted EPS: $0.91 vs analyst estimates of $0.90 (1.5% beat)
- Adjusted EBITDA: $639 million vs analyst estimates of $500.8 million (19.1% margin, 27.6% beat)
- Operating Margin: 23.8%, up from 2.2% in the same quarter last year
- Free Cash Flow Margin: 31.1%, up from 13.6% in the same quarter last year
- Market Capitalization: $15.19 billion
"We closed the year with a strong fourth quarter where across our businesses we delivered robust volume growth and operating earnings, capping off a record year for Ball. Our success reflects disciplined execution and the strength of the Ball Business System, serving our customers, empowering our people and culture, and driving operational excellence every shift, every day. These pillars enabled us to meet our 2025 expectations, achieve record earnings per share, and return approximately $1.54 billion to shareholders through share repurchases and dividends," said Ron Lewis, chief executive officer.
Company Overview
Started with a $200 loan in 1880, Ball (NYSE: BLL) manufactures aluminum packaging for beverages, personal care, and household products as well as aerospace systems and other technologies.
Revenue Growth
A company’s long-term sales performance can indicate its overall quality. Any business can put up a good quarter or two, but the best consistently grow over the long haul. Unfortunately, Ball’s 2.2% annualized revenue growth over the last five years was sluggish. This fell short of our benchmarks and is a tough starting point for our analysis.
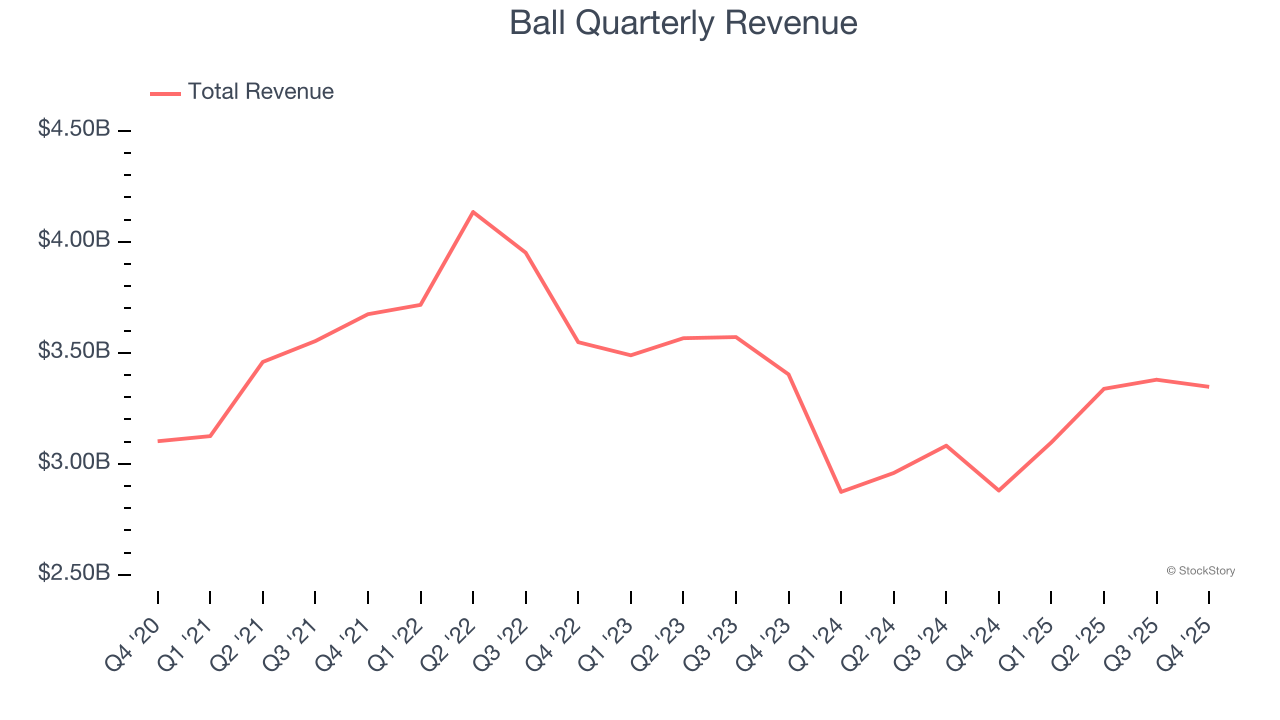
We at StockStory place the most emphasis on long-term growth, but within industrials, a half-decade historical view may miss cycles, industry trends, or a company capitalizing on catalysts such as a new contract win or a successful product line. Ball’s performance shows it grew in the past but relinquished its gains over the last two years, as its revenue fell by 3.1% annually. 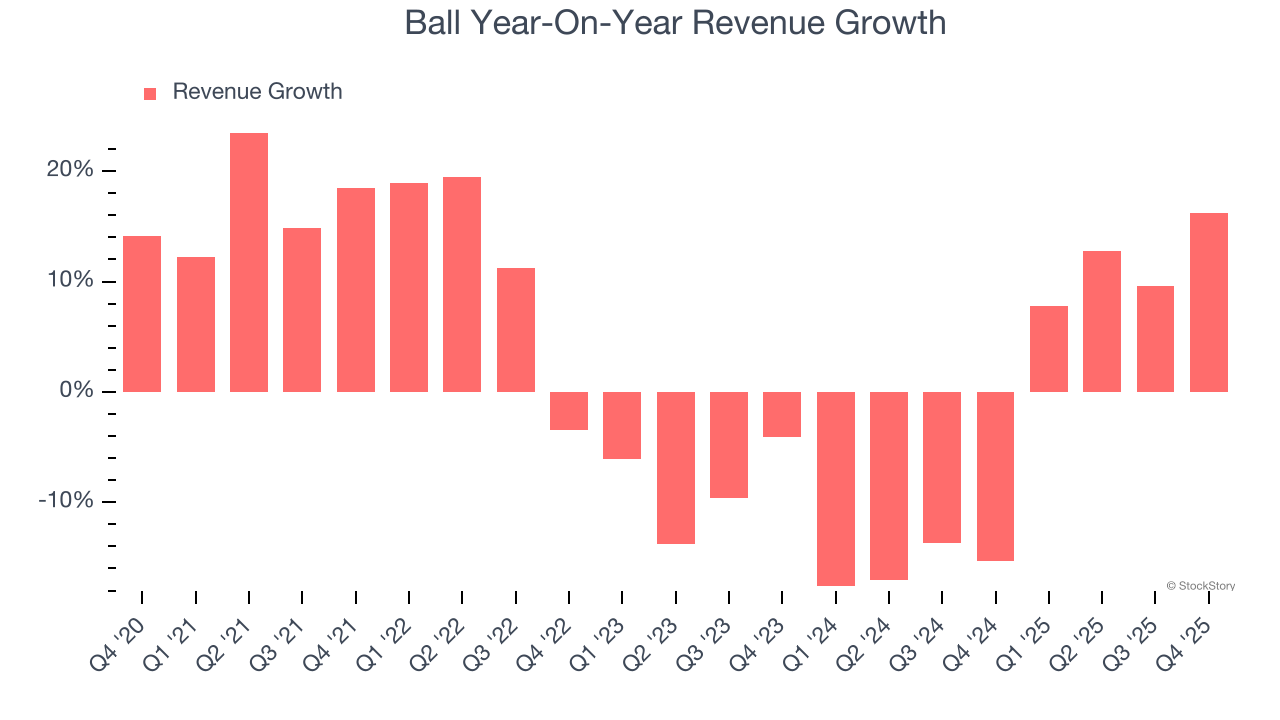
This quarter, Ball reported year-on-year revenue growth of 16.2%, and its $3.35 billion of revenue exceeded Wall Street’s estimates by 7.3%.
Looking ahead, sell-side analysts expect revenue to grow 2.7% over the next 12 months. Although this projection indicates its newer products and services will catalyze better top-line performance, it is still below average for the sector.
While Wall Street chases Nvidia at all-time highs, an under-the-radar semiconductor supplier is dominating a critical AI component these giants can’t build without. Click here to access our free report one of our favorites growth stories.
Operating Margin
Operating margin is one of the best measures of profitability because it tells us how much money a company takes home after procuring and manufacturing its products, marketing and selling those products, and most importantly, keeping them relevant through research and development.
Ball has done a decent job managing its cost base over the last five years. The company has produced an average operating margin of 9.4%, higher than the broader industrials sector.
Analyzing the trend in its profitability, Ball’s operating margin rose by 5.1 percentage points over the last five years, as its sales growth gave it operating leverage. Its expansion was impressive, especially when considering most Industrial Packaging peers saw their margins plummet.
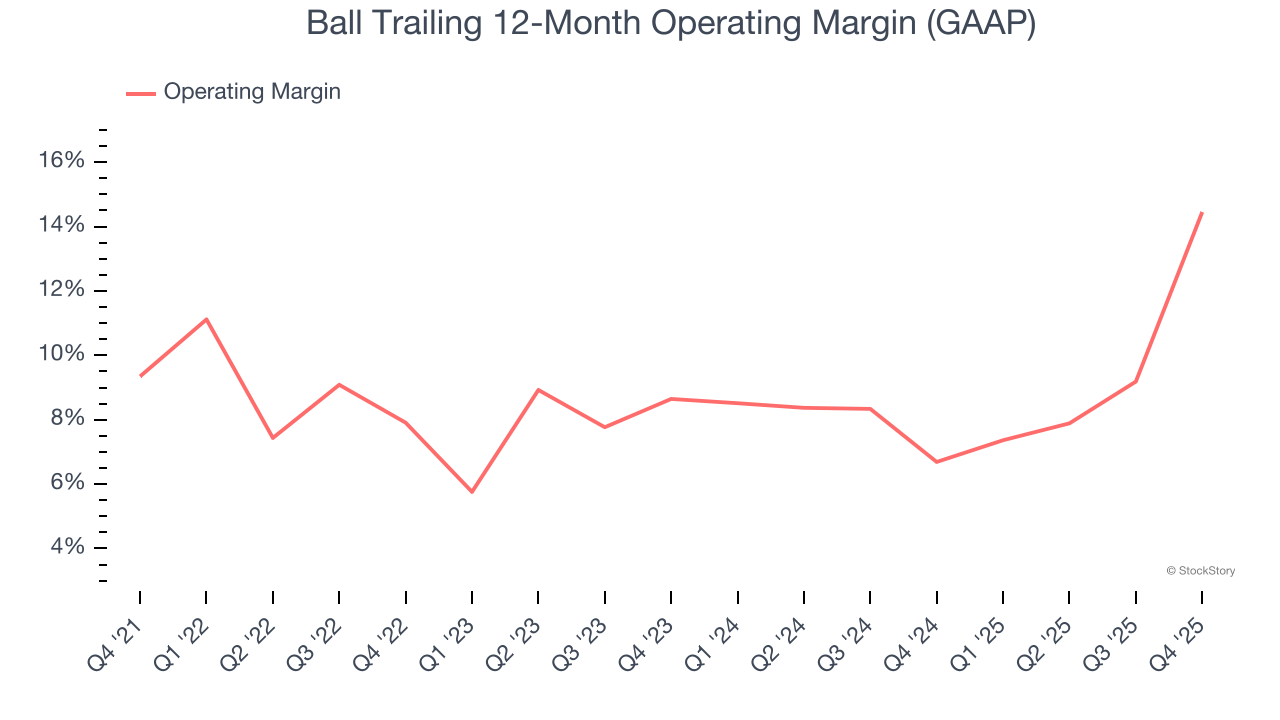
In Q4, Ball generated an operating margin profit margin of 23.8%, up 21.7 percentage points year on year. The increase was solid, and because its gross margin actually decreased, we can assume it was more efficient because its operating expenses like marketing, R&D, and administrative overhead grew slower than its revenue.
Earnings Per Share
Revenue trends explain a company’s historical growth, but the long-term change in earnings per share (EPS) points to the profitability of that growth – for example, a company could inflate its sales through excessive spending on advertising and promotions.
Ball’s weak 3.9% annual EPS growth over the last five years aligns with its revenue performance. On the bright side, this tells us its incremental sales were profitable.
Like with revenue, we analyze EPS over a more recent period because it can provide insight into an emerging theme or development for the business.
Ball’s two-year annual EPS growth of 11.1% was good and topped its two-year revenue performance.
We can take a deeper look into Ball’s earnings quality to better understand the drivers of its performance. Ball’s operating margin has expanded over the last two yearswhile its share count has shrunk 15.4%. These are positive signs for shareholders because improving profitability and share buybacks turbocharge EPS growth relative to revenue growth. 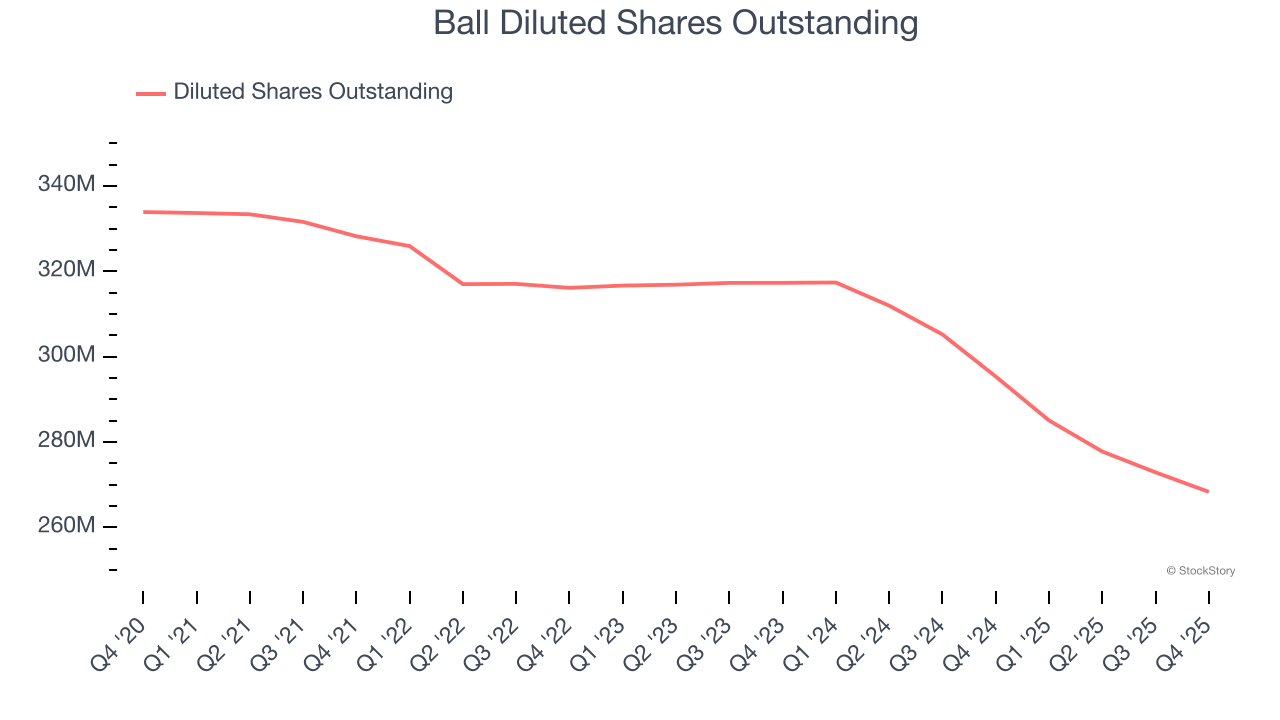
In Q4, Ball reported adjusted EPS of $0.91, up from $0.84 in the same quarter last year. This print beat analysts’ estimates by 1.5%. Over the next 12 months, Wall Street expects Ball’s full-year EPS of $3.59 to grow 10.5%.
Key Takeaways from Ball’s Q4 Results
We were impressed by how significantly Ball blew past analysts’ EBITDA expectations this quarter. We were also excited its revenue outperformed Wall Street’s estimates by a wide margin. Zooming out, we think this quarter featured some important positives. The stock traded up 2.9% to $58.34 immediately following the results.
Ball may have had a good quarter, but does that mean you should invest right now? What happened in the latest quarter matters, but not as much as longer-term business quality and valuation, when deciding whether to invest in this stock. We cover that in our actionable full research report which you can read here (it’s free).