
Internet service provider Cogent Communications (NASDAQ: CCOI) missed Wall Street’s revenue expectations in Q4 CY2025, with sales falling 4.7% year on year to $240.5 million. Its GAAP loss of $0.64 per share was 34.1% above analysts’ consensus estimates.
Is now the time to buy Cogent? Find out by accessing our full research report, it’s free.
Cogent (CCOI) Q4 CY2025 Highlights:
- Revenue: $240.5 million vs analyst estimates of $243.5 million (4.7% year-on-year decline, 1.2% miss)
- EPS (GAAP): -$0.64 vs analyst estimates of -$0.97 (34.1% beat)
- Adjusted EBITDA: $76.74 million vs analyst estimates of $77.32 million (31.9% margin, 0.7% miss)
- Operating Margin: -4.7%, up from -13% in the same quarter last year
- Free Cash Flow was -$43.02 million compared to -$31.57 million in the same quarter last year
- Total Connections: 117.6 million
- Market Capitalization: $1.25 billion
Company Overview
Operating a massive network spanning 20,000 miles of fiber optic cable and connecting to over 3,200 buildings worldwide, Cogent Communications (NASDAQ: CCOI) provides high-speed Internet access, private network services, and data center colocation to businesses and bandwidth-intensive organizations across 54 countries.
Revenue Growth
A company’s long-term sales performance can indicate its overall quality. Any business can put up a good quarter or two, but many enduring ones grow for years.
With $975.8 million in revenue over the past 12 months, Cogent is a small player in the business services space, which sometimes brings disadvantages compared to larger competitors benefiting from economies of scale and numerous distribution channels. On the bright side, it can grow faster because it has more room to expand.
As you can see below, Cogent’s 11.4% annualized revenue growth over the last five years was excellent. This shows it had high demand, a useful starting point for our analysis.
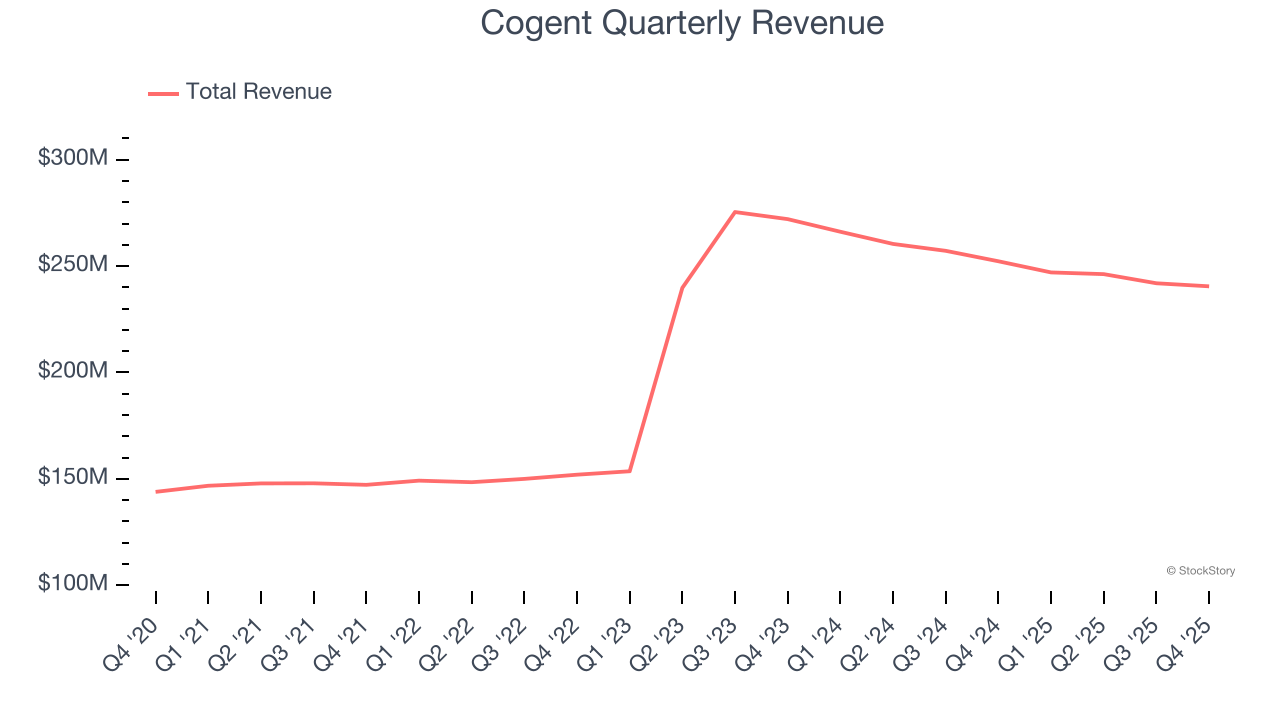
We at StockStory place the most emphasis on long-term growth, but within business services, a half-decade historical view may miss recent innovations or disruptive industry trends. Cogent’s recent performance shows its demand has slowed significantly as its annualized revenue growth of 1.8% over the last two years was well below its five-year trend. 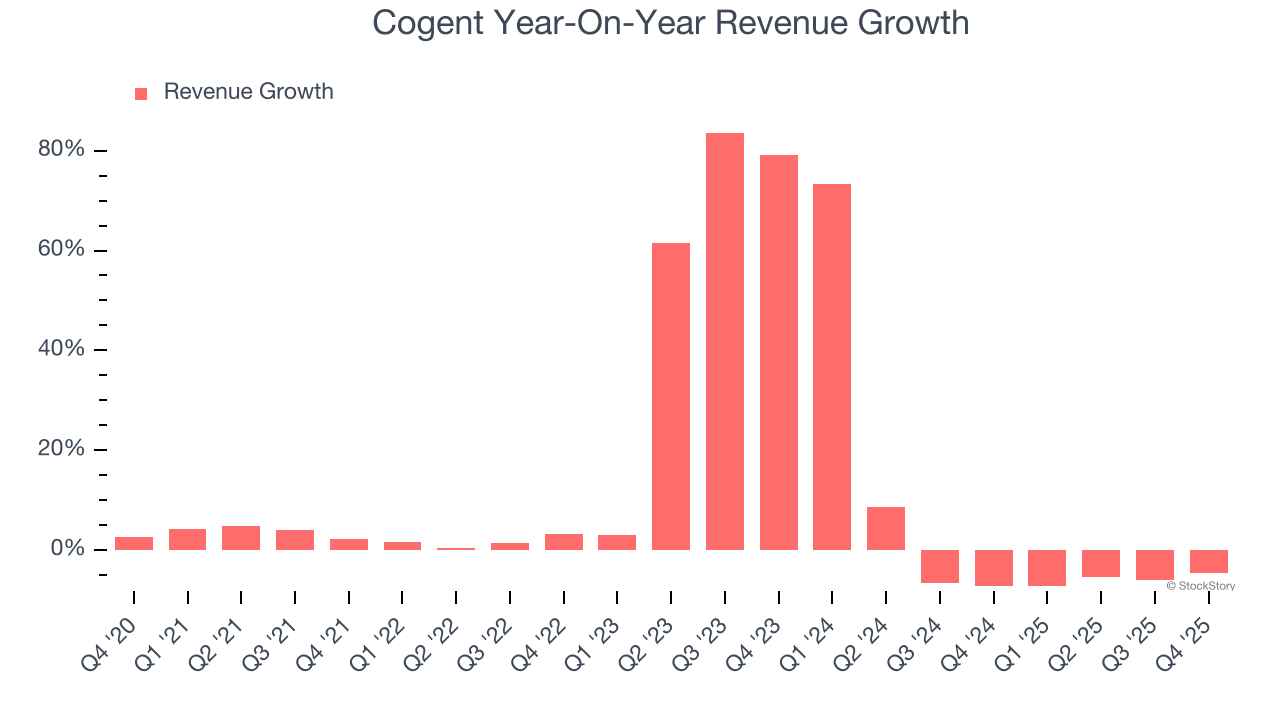
This quarter, Cogent missed Wall Street’s estimates and reported a rather uninspiring 4.7% year-on-year revenue decline, generating $240.5 million of revenue.
Looking ahead, sell-side analysts expect revenue to grow 3% over the next 12 months, similar to its two-year rate. Although this projection indicates its newer products and services will catalyze better top-line performance, it is still below average for the sector.
Microsoft, Alphabet, Coca-Cola, Monster Beverage—all began as under-the-radar growth stories riding a massive trend. We’ve identified the next one: a profitable AI semiconductor play Wall Street is still overlooking. Go here for access to our full report.
Operating Margin
Cogent’s high expenses have contributed to an average operating margin of negative 4.7% over the last five years. Unprofitable business services companies require extra attention because they could get caught swimming naked when the tide goes out. It’s hard to trust that the business can endure a full cycle.
Analyzing the trend in its profitability, Cogent’s operating margin decreased by 30.6 percentage points over the last five years. This raises questions about the company’s expense base because its revenue growth should have given it leverage on its fixed costs, resulting in better economies of scale and profitability. Cogent’s performance was poor no matter how you look at it - it shows that costs were rising and it couldn’t pass them onto its customers.
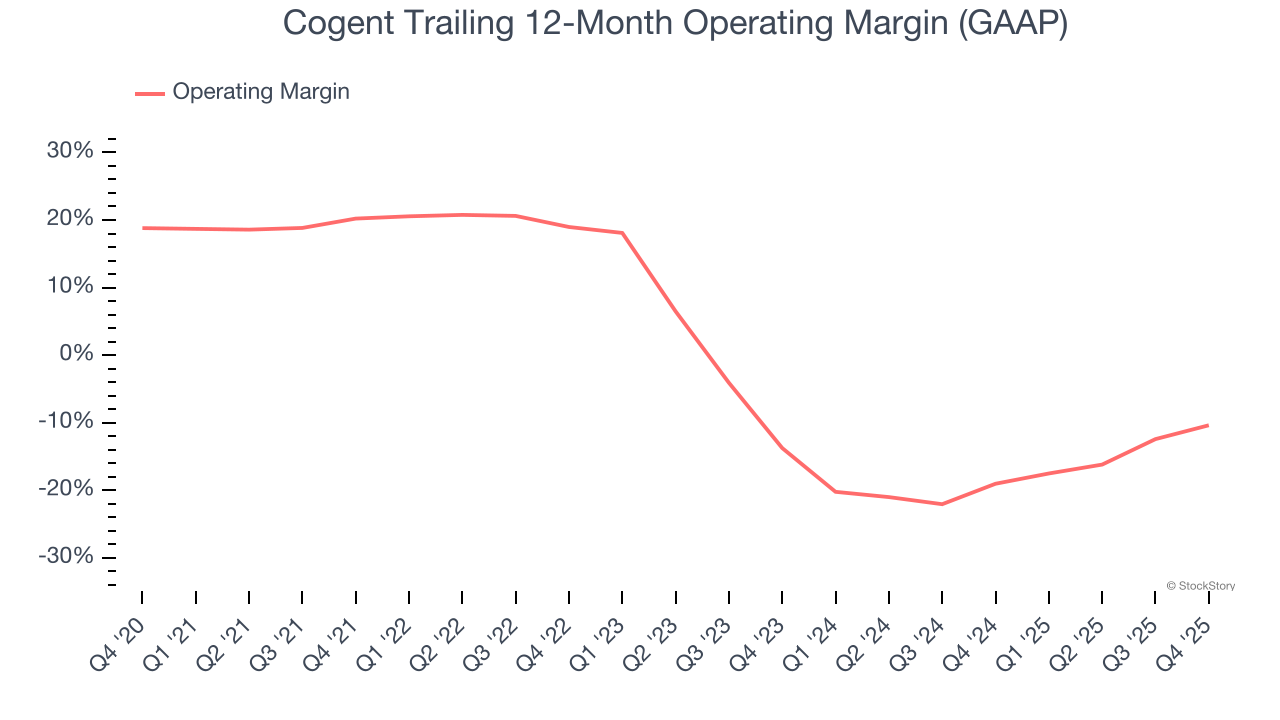
Cogent’s operating margin was negative 4.7% this quarter.
Earnings Per Share
Revenue trends explain a company’s historical growth, but the long-term change in earnings per share (EPS) points to the profitability of that growth – for example, a company could inflate its sales through excessive spending on advertising and promotions.
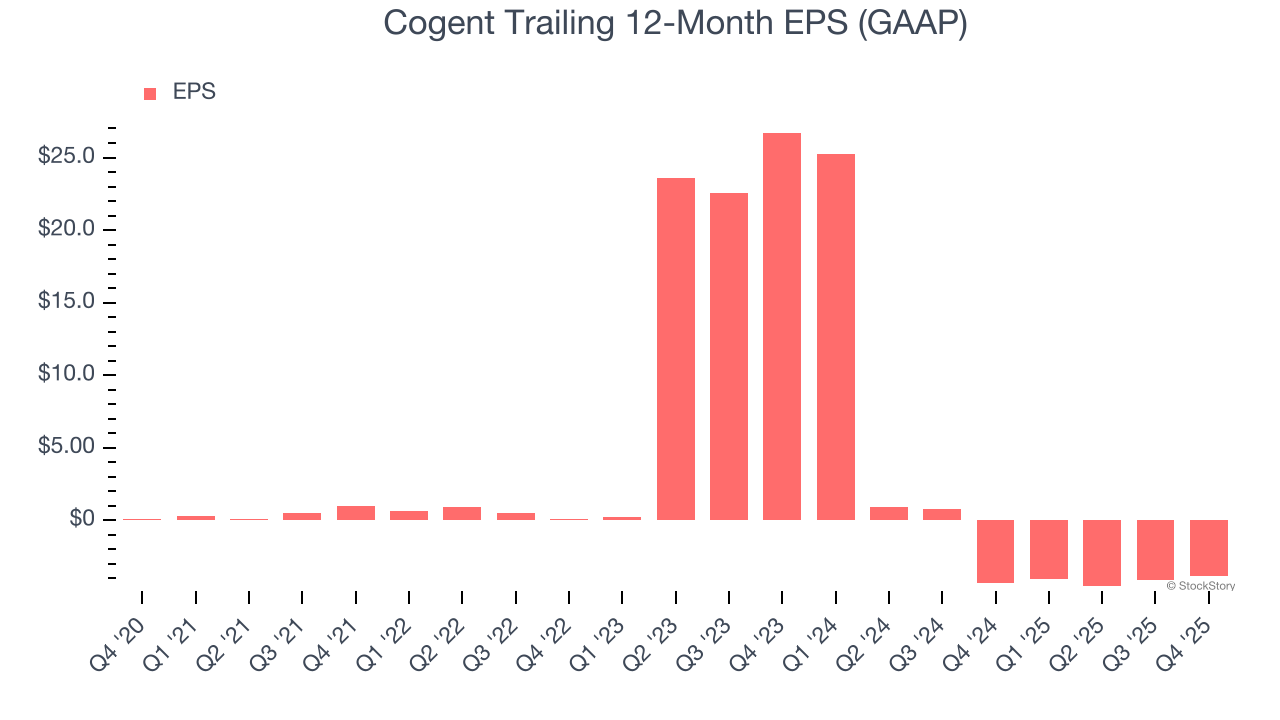
Sadly for Cogent, its EPS declined by 99.2% annually over the last five years while its revenue grew by 11.4%. This tells us the company became less profitable on a per-share basis as it expanded.
Diving into the nuances of Cogent’s earnings can give us a better understanding of its performance. As we mentioned earlier, Cogent’s operating margin expanded this quarter but declined by 30.6 percentage points over the last five years. Its share count also grew by 4%, meaning the company not only became less efficient with its operating expenses but also diluted its shareholders. 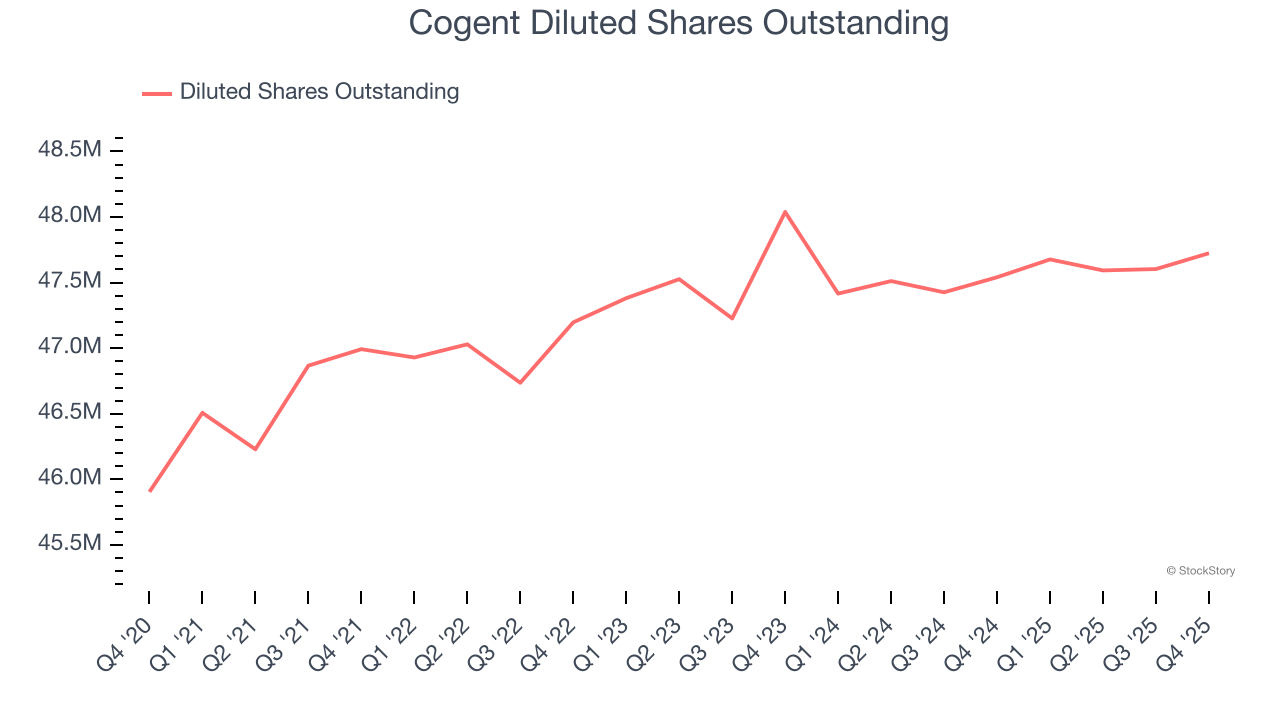
Like with revenue, we analyze EPS over a more recent period because it can provide insight into an emerging theme or development for the business.
For Cogent, its two-year annual EPS declines of 46.4% show it’s still underperforming. These results were bad no matter how you slice the data.
In Q4, Cogent reported EPS of negative $0.64, up from negative $0.91 in the same quarter last year. This print easily cleared analysts’ estimates, and shareholders should be content with the results. Over the next 12 months, Wall Street expects Cogent to improve its earnings losses. Analysts forecast its full-year EPS of negative $3.82 will advance to negative $3.59.
Key Takeaways from Cogent’s Q4 Results
It was good to see Cogent beat analysts’ EPS expectations this quarter. On the other hand, its revenue slightly missed. Overall, we think this was a mixed quarter. Investors were likely hoping for more, and shares traded down 1.7% to $25.86 immediately following the results.
Is Cogent an attractive investment opportunity at the current price? The latest quarter does matter, but not nearly as much as longer-term fundamentals and valuation, when deciding if the stock is a buy. We cover that in our actionable full research report which you can read here (it’s free).