Building materials manufacturer UFP Industries (NASDAQ: UFPI) beat Wall Street’s revenue expectations in Q3 2026, with revenue up 11.1% year on year to $1.73 billion. Its GAAP profit of $1.05 per share was 11.8% below analysts’ consensus estimates.
For more on UFP Industries, read our free full research report.
UFP Industries (UFPI) Q3 2026 highlights:
- Revenue $1.73 billion vs S&P analysts’ consensus estimates of $1.6 billion (11.1% year-on-year growth, 8.3% beat)
- EPS (GAAP) $1.05 vs analysts’ consensus estimates of $1.19 (11.8% miss)
- Adjusted EBITDA $119.3 million vs analysts’ consensus estimates of $133.4 million (6.9% margin, 10.6% miss)
- Operating margin 4%, down from 5.7% in the same quarter last year
- Free cash flow margin 7.9%, down from 13.5% in the same quarter last year
- Market capitalization $4.40 billion
Schwartz continued, "Our financial position remains a competitive advantage. We ended the quarter with approximately $2 billion of liquidity and no borrowings outstanding under our revolving credit facility, giving us the flexibility to invest through the cycle. So far this year, we have completed three acquisitions, announced a fourth, and returned more than $240 million to shareholders through dividends and share repurchases. Our M&A pipeline remains active, and we will stay disciplined, pursuing opportunities that strengthen our core businesses, expand our value-added portfolio, and meet our return criteria."
Revenue growth
A company’s long-term revenue performance is one signal of its overall quality. Any business can experience short-term success, but top-performing ones sustain growth for years. UFP Industries’s demand was weak over the last five years as its revenue fell at a 4.4% annual rate. That underwhelming result suggests poor business quality.
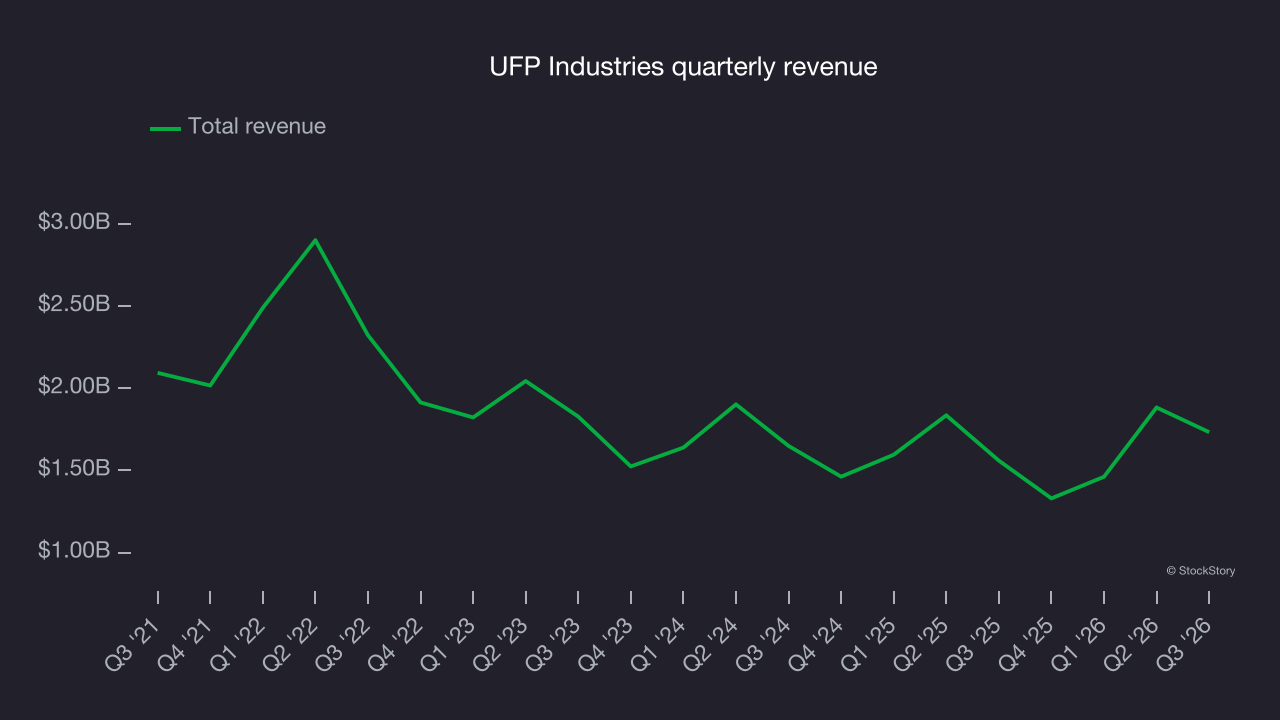
Long-term growth matters most, but within industrials, a half-decade historical view may miss cycles, industry trends or a company capitalizing on catalysts such as a new contract win or a successful product line. UFP Industries’s annualized revenue declines of 2.3% over the last two years suggest its demand continued shrinking. 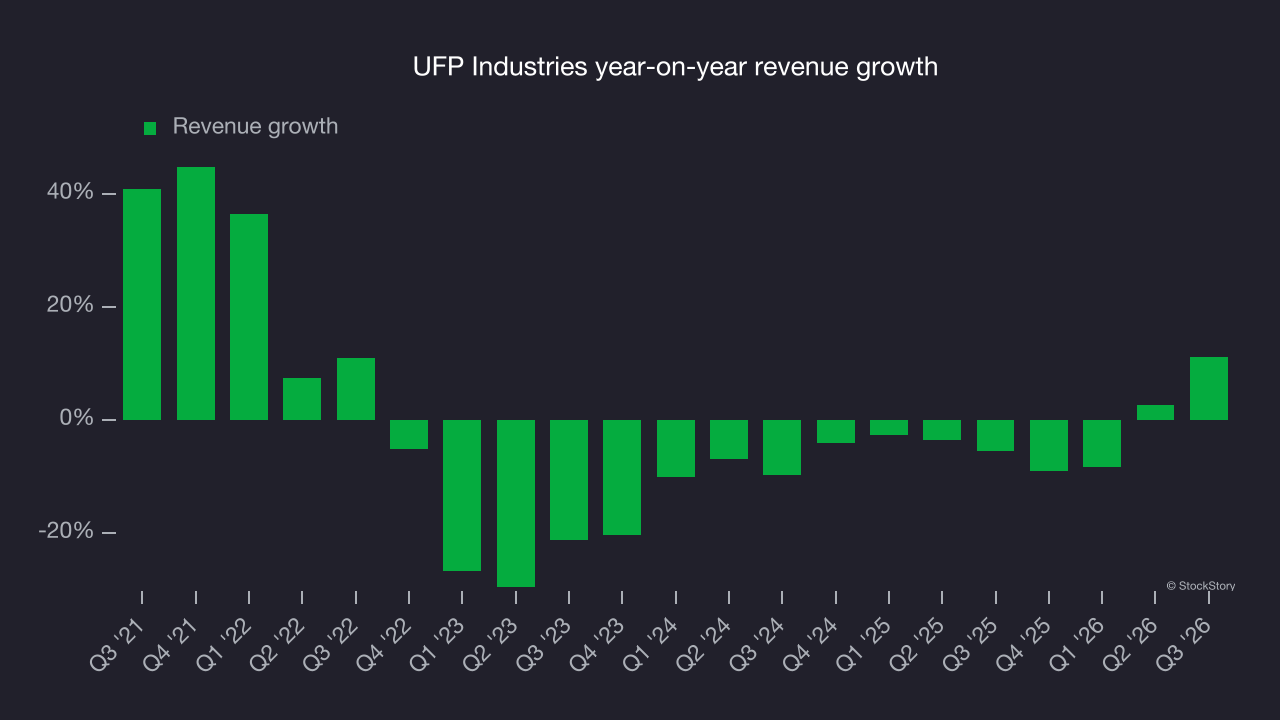
This quarter, UFP Industries reported year-on-year revenue growth of 11.1%, and its $1.73 billion of revenue exceeded Wall Street’s consensus estimates by 8.3%.
Looking ahead, sell-side analysts expect revenue to grow 2.1% over the next 12 months, according to S&P. Although this projection suggests its newer products and services will fuel better top-line performance, it is still below the sector average.
Operating margin
UFP Industries was profitable over the last five years but held back by its large cost base. Its average operating margin of 7.8% was weak for an industrials business. That outcome is unsurprising given its low gross margin baseline.
Looking at the trend in its profitability, UFP Industries’s operating margin decreased by 5.4 percentage points over the last five years. Its performance was poor, indicating that costs were rising and it couldn’t pass them on to customers.
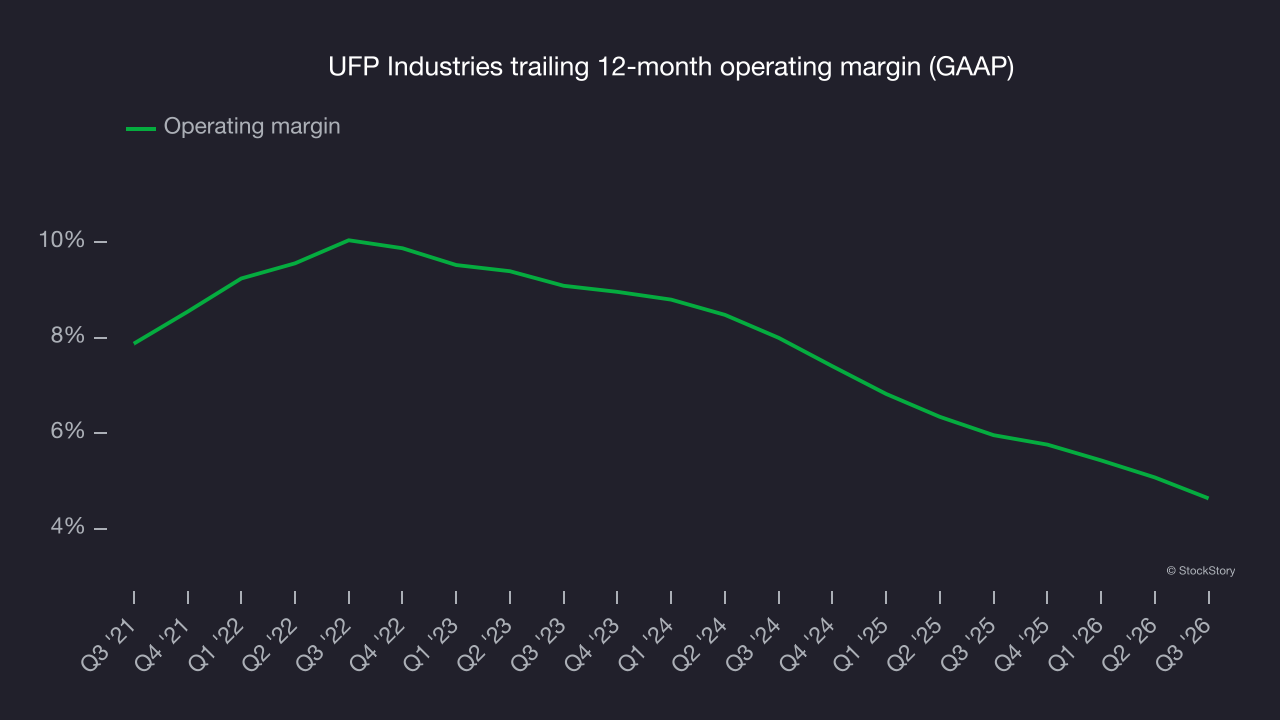
This quarter, UFP Industries generated an operating margin of 4%, down 1.7 percentage points year on year. Since UFP Industries’s gross margin decreased more than its operating margin, its recent inefficiencies were likely driven more by weaker leverage on its cost of sales than by increased marketing, R&D and administrative overhead expenses.
Earnings per share
We track the long-term change in earnings per share (EPS) for the same reason as long-term revenue growth. Compared to revenue, however, EPS highlights whether a company’s growth is profitable.
UFP Industries’s EPS declined by 11.2% annually over the last five years, more than its revenue. This indicates the company struggled because its fixed cost base made it difficult to adjust to shrinking demand.
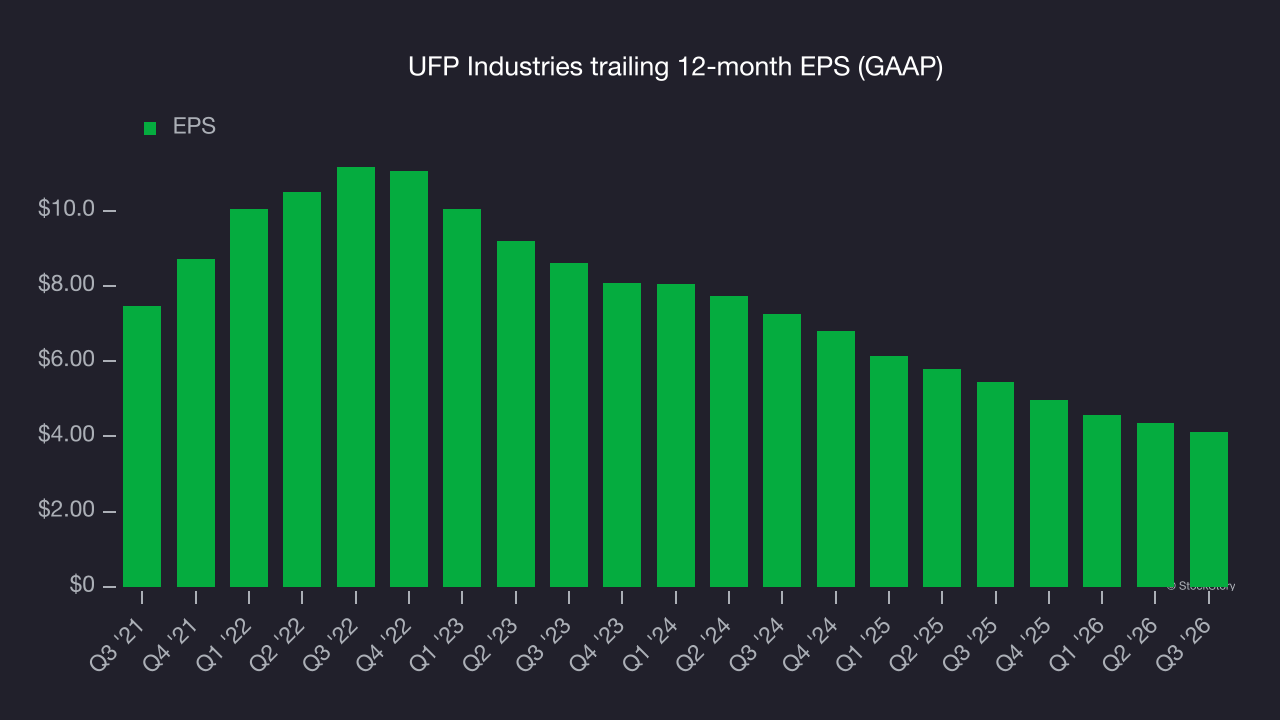
A closer look at UFP Industries’s earnings helps explain the drivers of its performance. As mentioned earlier, UFP Industries’s operating margin declined by 5.4 percentage points over the last five years. This was the most relevant factor (aside from the revenue impact) behind its lower earnings; interest expenses and taxes can also affect EPS but don’t tell us as much about a company’s fundamentals.
Like with revenue, we analyze EPS over a shorter period to see if we are missing a change in the business.
For UFP Industries, its two-year annual EPS declines of 24.7% show it’s continued to underperform. These results were poor regardless of the time frame.
In Q3, UFP Industries reported EPS of $1.05, down from $1.29 in the same quarter last year. That missed analysts’ consensus estimates. Over the next 12 months, Wall Street expects UFP Industries’s full-year EPS to grow 25.9% from $4.12 to $5.19, according to S&P.
Key takeaways from UFP Industries’s Q3 results
A sizable revenue beat was the bright spot in UFP Industries’ otherwise softer quarter, with EBITDA missing expectations and EPS falling short of Wall Street’s consensus estimates. Shares fell 4.8% to $74.43 immediately after the results.
UFP Industries had an underwhelming quarter. To assess the stock at its current price, consider the bigger picture: valuation, business quality and the latest earnings. For more on UFP Industries, read the full research report here (it’s free).