Solar tracker company Nextpower (NASDAQ: NXT) beat Wall Street’s revenue expectations in calendar Q3 2026 (fiscal Q2 2027), with revenue up 22.5% year on year to $1.11 billion. The company expects the full year’s revenue to be around $4.33 billion, close to analysts’ consensus estimates. Its non-GAAP profit of $1.31 per share was 19.2% above analysts’ consensus estimates.
For more on Nextpower, read our free full research report.
Nextpower (NXT) Q3 CY2026 highlights:
- Revenue $1.11 billion vs S&P analysts’ consensus estimates of $1.07 billion (22.5% year-on-year growth, 4% beat)
- Adjusted EPS $1.31 vs S&P analysts’ consensus estimates of $1.10 (19.2% beat)
- Adjusted EBITDA $249.7 million vs analysts’ consensus estimates of $218.8 million (22.5% margin, 14.1% beat)
- Revenue guidance The company lifted its revenue guidance for the full year to $4.33 billion at the midpoint from $4.25 billion, a 1.8% increase
- Adjusted EPS guidance Management raised its full-year adjusted EPS guidance to $4.74 at the midpoint, a 3.6% increase
- EBITDA guidance $915 million at the midpoint for the full year, in line with analysts’ consensus estimates
- Operating margin 18.7%, down from 20% in the same quarter last year
- Free cash flow margin 12.2%, down from 18.9% in the same quarter last year
- Backlog $6 billion at quarter end, up 20% year on year
- Market capitalization $12.05 billion
“Nextpower delivered record quarterly revenue and bookings and grew backlog to more than $6 billion, reflecting continued demand strength for our tracker products, alongside rapidly accelerating demand and orders for our additional products and services,” said Dan Shugar, CEO and founder of Nextpower. “Customer adoption of our integrated platform is growing. Recent examples include energy storage and other complementary offerings accounting for approximately 22% of our Q2 revenue, record quarterly eBOS bookings of more than $100 million, and a 1.1-gigawatt inverter supply agreement signed with a leading Tier 1 IPP. These achievements reflect the strength of our customer relationships and differentiated technology. We remain focused on expanding our participation across the project lifecycle, helping customers build faster, enhance yield, and optimize long-term operation.”
Revenue growth
A company’s long-term performance is an indicator of its overall quality. Any business can deliver a good quarter or two, but the best consistently grow over the long haul. Over the last five years, Nextpower grew its revenue at a strong 24.3% compounded annual growth rate. Its growth surpassed the average industrials company and shows its offerings resonate with customers.
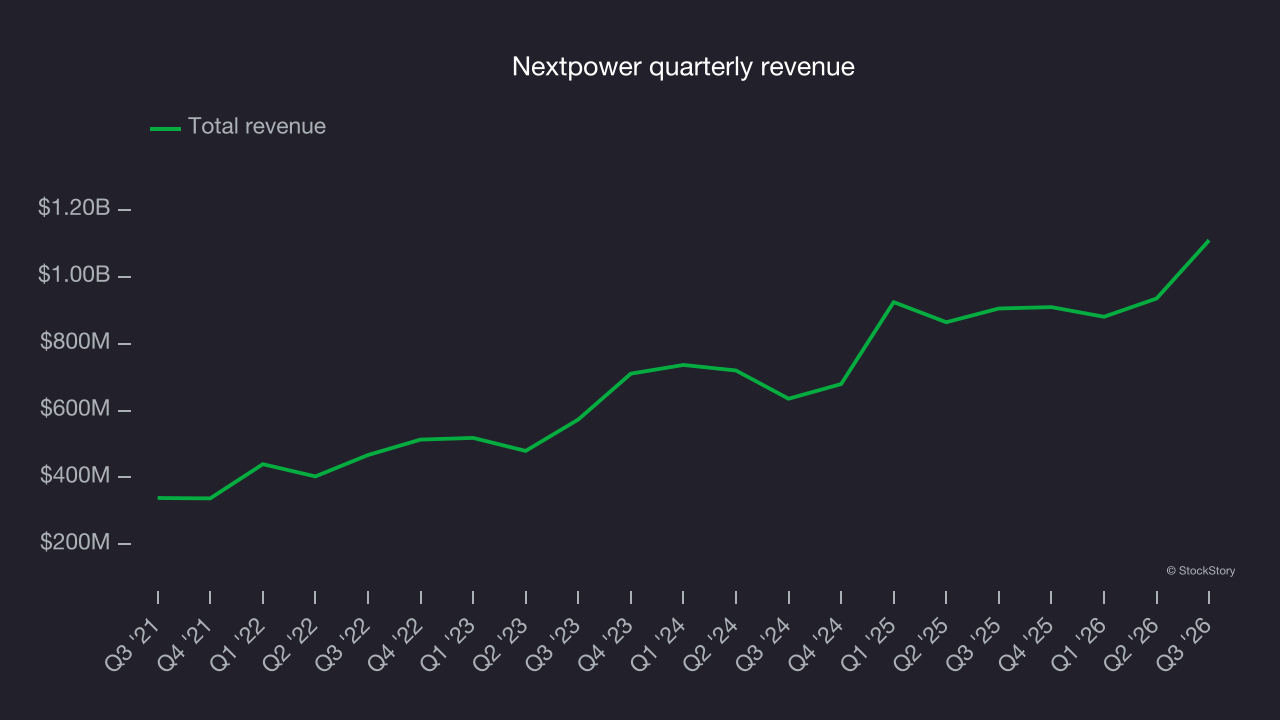
Long-term growth matters the most, but within industrials, a half-decade historical view may miss cycles, industry trends or a company capitalizing on catalysts such as a new contract win or a successful product line. Nextpower’s annualized revenue growth of 17% over the last two years is below its five-year trend, but the results still suggest healthy demand. 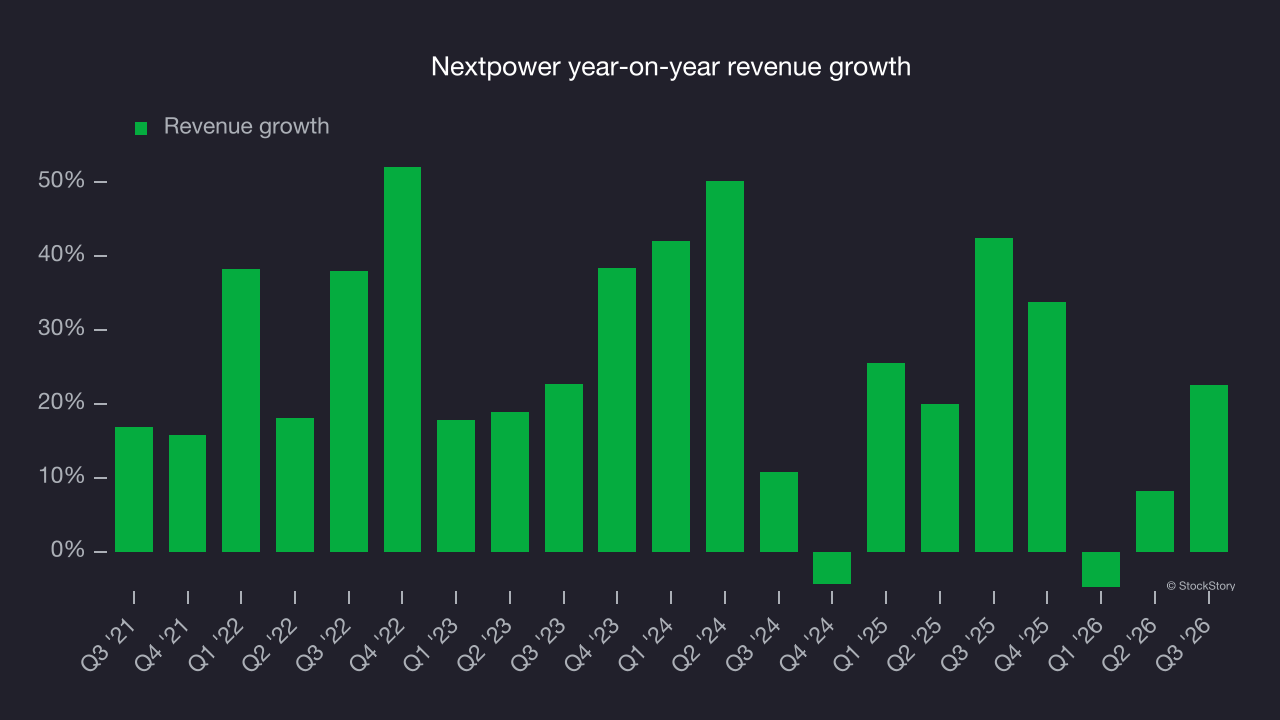
This quarter, Nextpower reported strong year-on-year revenue growth of 22.5%, and its $1.11 billion of revenue topped Wall Street’s consensus estimates by 4%.
Looking ahead, sell-side analysts expect revenue to grow 26.5% over the next 12 months, according to S&P, an improvement versus the last two years. This projection implies its newer products and services will fuel better revenue growth.
Operating margin
Nextpower has operated efficiently over the last five years. It demonstrated strong profitability for an industrials business, with an average operating margin of 18.3%. This result was particularly impressive given its low gross margin, which is mostly a factor of what it sells and requires substantial shifts to change meaningfully. Companies have more control over their operating margins, and high operating margins alongside low gross margins indicate well-managed operations.
Analyzing the trend in its profitability, Nextpower’s operating margin rose by 13.3 percentage points over the last five years, as its revenue growth provided operating leverage.
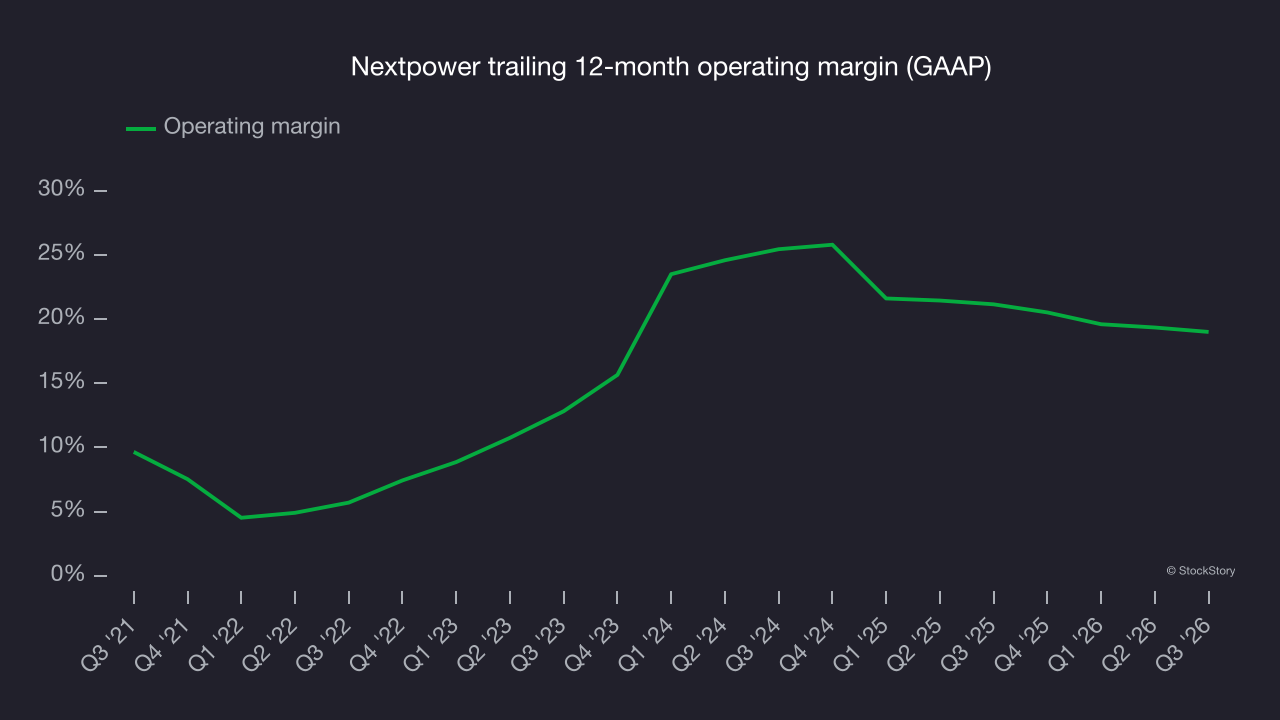
In Q3, Nextpower generated an operating margin of 18.7%, down 1.3 percentage points year on year. Its operating margin decreased more than its gross margin, suggesting reduced efficiency as expenses such as marketing, R&D and administrative overhead increased.
Free cash flow
Free cash flow matters because accounting profits alone cannot pay the bills.
Nextpower has shown strong cash profitability, enabling it to weather cyclical downturns while investing in new offerings and returning capital to investors. The company’s free cash flow margin averaged 12.9% over the last five years, an impressive level for an industrials business.
On the positive side, Nextpower’s free cash flow margin expanded by 17.8 percentage points during that time. It became a less capital-intensive business, as its free cash flow profitability rose more than its operating profitability.
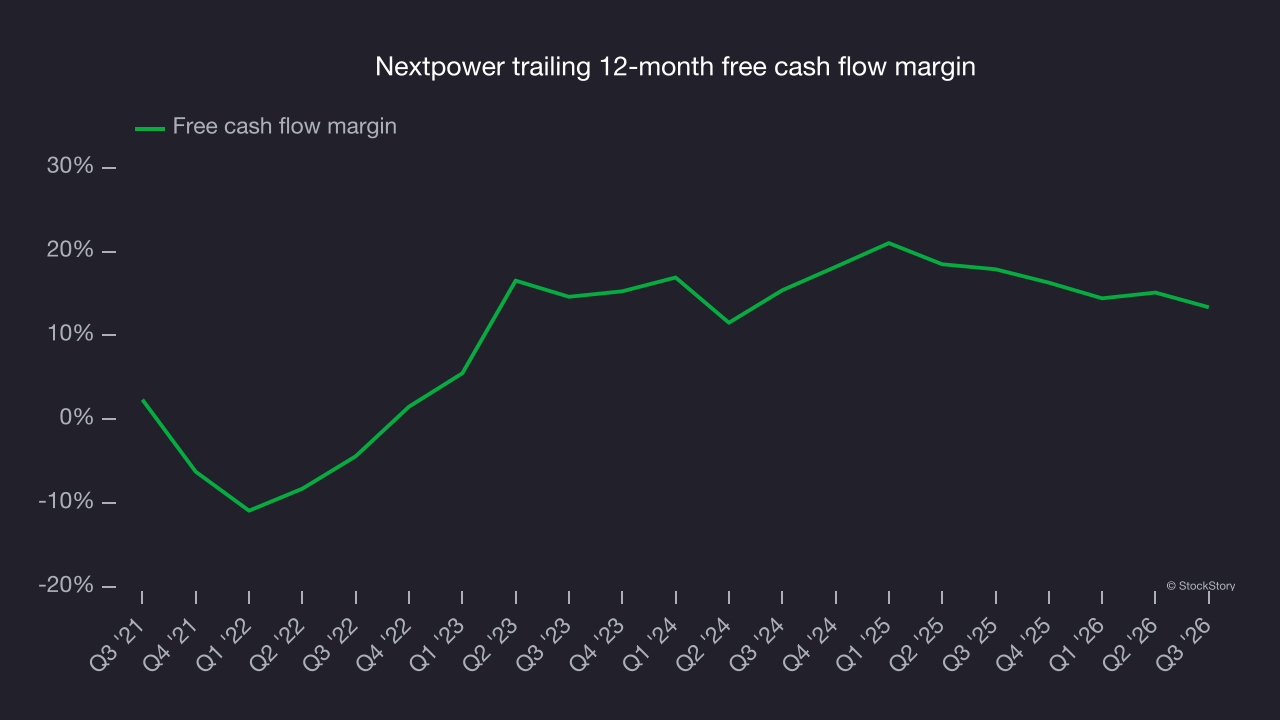
Nextpower’s free cash flow totaled $135 million in Q3, equivalent to a 12.2% margin. The company’s cash profitability declined by 6.8 percentage points from the same quarter last year, but that decline warrants limited weight because capital expenditures can be seasonal and companies often stockpile inventory in anticipation of higher demand, causing quarter-to-quarter swings. Long-term trends are more important.
Key takeaways from Nextpower’s Q3 results
Wide beats on both EBITDA and revenue made this a solid quarter for Nextpower, with both measures coming in well above analysts’ consensus estimates. Shares remained flat at $82.59 immediately after the results.
Nextpower had a solid quarter, but deciding whether to buy the stock requires a broader view. It’s important to consider its valuation and business quality as well as what happened in the latest quarter. For more on those factors, read our full research report here (it’s free).