
Global electronics contract manufacturer Kimball Electronics (NYSE: KE) reported revenue ahead of Wall Streets expectations in Q3 CY2025, but sales fell by 2.3% year on year to $365.6 million. The company expects the full year’s revenue to be around $1.4 billion, close to analysts’ estimates. Its non-GAAP profit of $0.49 per share was 81.5% above analysts’ consensus estimates.
Is now the time to buy Kimball Electronics? Find out by accessing our full research report, it’s free for active Edge members.
Kimball Electronics (KE) Q3 CY2025 Highlights:
- Revenue: $365.6 million vs analyst estimates of $338.4 million (2.3% year-on-year decline, 8% beat)
- Adjusted EPS: $0.49 vs analyst estimates of $0.27 (81.5% beat)
- Adjusted EBITDA: $25.12 million vs analyst estimates of $21.4 million (6.9% margin, 17.4% beat)
- The company reconfirmed its revenue guidance for the full year of $1.4 billion at the midpoint
- Operating Margin: 4%, up from 2.8% in the same quarter last year
- Free Cash Flow Margin: 2.2%, down from 8.6% in the same quarter last year
- Market Capitalization: $702.1 million
Company Overview
Founded in 1961, Kimball Electronics (NYSE: KE) is a global contract manufacturer specializing in electronics and manufacturing solutions for automotive, medical, and industrial markets.
Revenue Growth
A company’s long-term sales performance can indicate its overall quality. Any business can have short-term success, but a top-tier one grows for years. Over the last five years, Kimball Electronics grew its sales at a sluggish 3.9% compounded annual growth rate. This was below our standard for the industrials sector and is a rough starting point for our analysis.
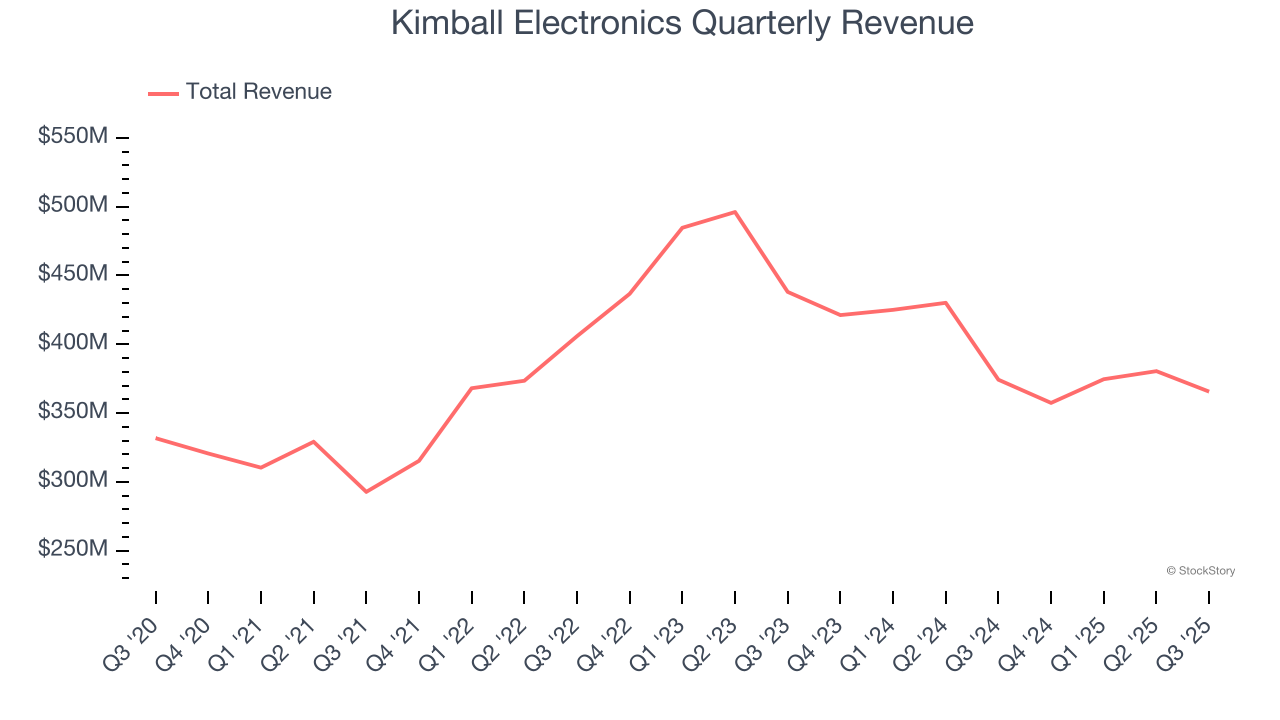
Long-term growth is the most important, but within industrials, a half-decade historical view may miss new industry trends or demand cycles. Kimball Electronics’s performance shows it grew in the past but relinquished its gains over the last two years, as its revenue fell by 10.8% annually. 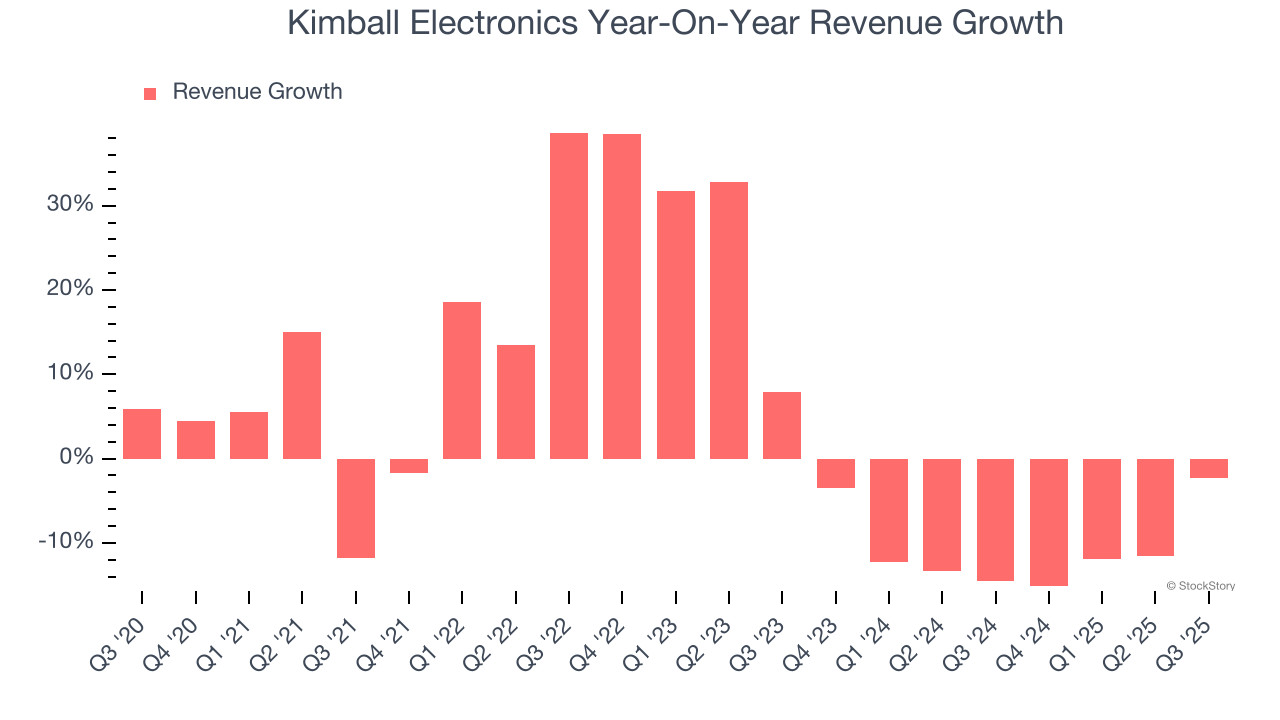
This quarter, Kimball Electronics’s revenue fell by 2.3% year on year to $365.6 million but beat Wall Street’s estimates by 8%.
Looking ahead, sell-side analysts expect revenue to decline by 3.9% over the next 12 months. Although this projection is better than its two-year trend, it’s tough to feel optimistic about a company facing demand difficulties.
Software is eating the world and there is virtually no industry left that has been untouched by it. That drives increasing demand for tools helping software developers do their jobs, whether it be monitoring critical cloud infrastructure, integrating audio and video functionality, or ensuring smooth content streaming. Click here to access a free report on our 3 favorite stocks to play this generational megatrend.
Operating Margin
Operating margin is one of the best measures of profitability because it tells us how much money a company takes home after procuring and manufacturing its products, marketing and selling those products, and most importantly, keeping them relevant through research and development.
Kimball Electronics’s operating margin might fluctuated slightly over the last 12 months but has generally stayed the same, averaging 4.4% over the last five years. This profitability was lousy for an industrials business and caused by its suboptimal cost structureand low gross margin.
Looking at the trend in its profitability, Kimball Electronics’s operating margin might fluctuated slightly but has generally stayed the same over the last five years. This raises questions about the company’s expense base because its revenue growth should have given it leverage on its fixed costs, resulting in better economies of scale and profitability.
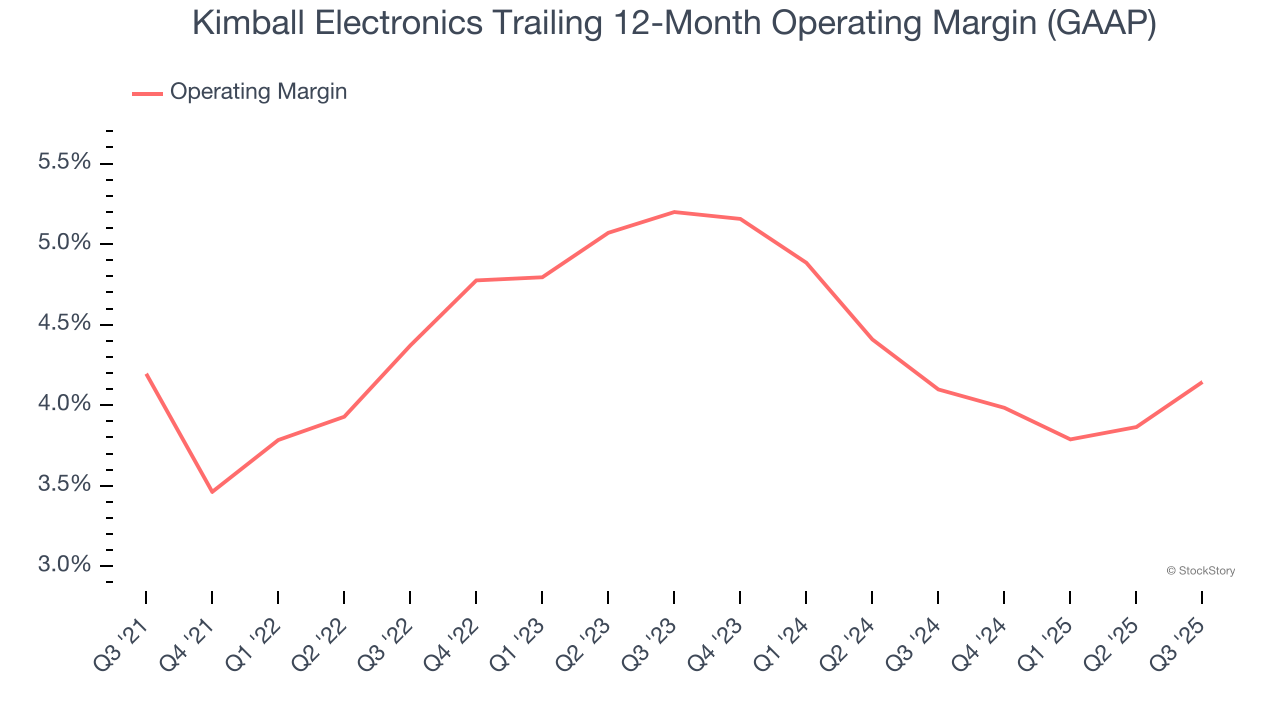
In Q3, Kimball Electronics generated an operating margin profit margin of 4%, up 1.1 percentage points year on year. Since its gross margin expanded more than its operating margin, we can infer that leverage on its cost of sales was the primary driver behind the recently higher efficiency.
Earnings Per Share
We track the long-term change in earnings per share (EPS) for the same reason as long-term revenue growth. Compared to revenue, however, EPS highlights whether a company’s growth is profitable.
Sadly for Kimball Electronics, its EPS declined by 2.4% annually over the last five years while its revenue grew by 3.9%. However, its operating margin didn’t change during this time, telling us that non-fundamental factors such as interest and taxes affected its ultimate earnings.
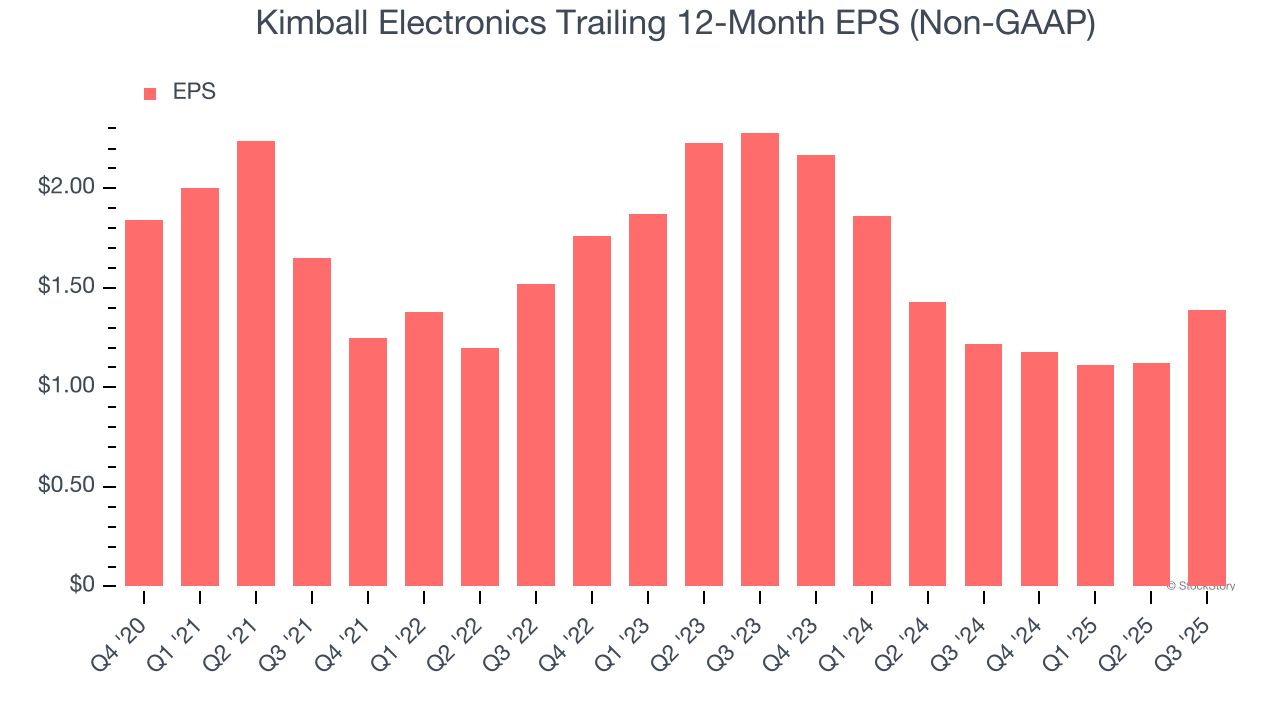
Like with revenue, we analyze EPS over a more recent period because it can provide insight into an emerging theme or development for the business.
For Kimball Electronics, its two-year annual EPS declines of 21.9% show it’s continued to underperform. These results were bad no matter how you slice the data.
In Q3, Kimball Electronics reported adjusted EPS of $0.49, up from $0.22 in the same quarter last year. This print easily cleared analysts’ estimates, and shareholders should be content with the results. Over the next 12 months, Wall Street expects Kimball Electronics’s full-year EPS of $1.39 to shrink by 3.4%.
Key Takeaways from Kimball Electronics’s Q3 Results
It was good to see Kimball Electronics beat analysts’ EPS expectations this quarter. We were also excited its EBITDA outperformed Wall Street’s estimates by a wide margin. Zooming out, we think this was a good print with some key areas of upside. The stock traded up 1.9% to $30.98 immediately following the results.
Indeed, Kimball Electronics had a rock-solid quarterly earnings result, but is this stock a good investment here? When making that decision, it’s important to consider its valuation, business qualities, as well as what has happened in the latest quarter. We cover that in our actionable full research report which you can read here, it’s free for active Edge members.


