
Precision motion systems specialist Allient (NASDAQ: ALNT) reported Q3 CY2025 results topping the market’s revenue expectations, with sales up 10.8% year on year to $138.7 million. Its non-GAAP profit of $0.59 per share was 20.4% above analysts’ consensus estimates.
Is now the time to buy Allient? Find out by accessing our full research report, it’s free for active Edge members.
Allient (ALNT) Q3 CY2025 Highlights:
- Revenue: $138.7 million vs analyst estimates of $134.2 million (10.8% year-on-year growth, 3.4% beat)
- Adjusted EPS: $0.59 vs analyst estimates of $0.49 (20.4% beat)
- Adjusted EBITDA: $20.3 million vs analyst estimates of $17.52 million (14.6% margin, 15.9% beat)
- Operating Margin: 8.8%, up from 5.5% in the same quarter last year
- Free Cash Flow Margin: 2%, down from 8.4% in the same quarter last year
- Backlog: $231 million at quarter end
- Market Capitalization: $909.7 million
“Our results underscore the strong progress we are making. We delivered record gross margin of 33.3% and expanded operating margin by 350 basis points year-over-year on 11% revenue growth, while achieving robust cash generation and deleveraging year-to-date. Demand remained healthy across Industrial applications, particularly power quality solutions for data center infrastructure, and we continued to execute on key defense and medical applications,” commented Dick Warzala, Chairman and CEO.
Company Overview
Founded in 1962, Allient (NASDAQ: ALNT) develops and manufactures precision and specialty-controlled motion components and systems.
Revenue Growth
Reviewing a company’s long-term sales performance reveals insights into its quality. Any business can put up a good quarter or two, but the best consistently grow over the long haul. Over the last five years, Allient grew its sales at a decent 8.1% compounded annual growth rate. Its growth was slightly above the average industrials company and shows its offerings resonate with customers.
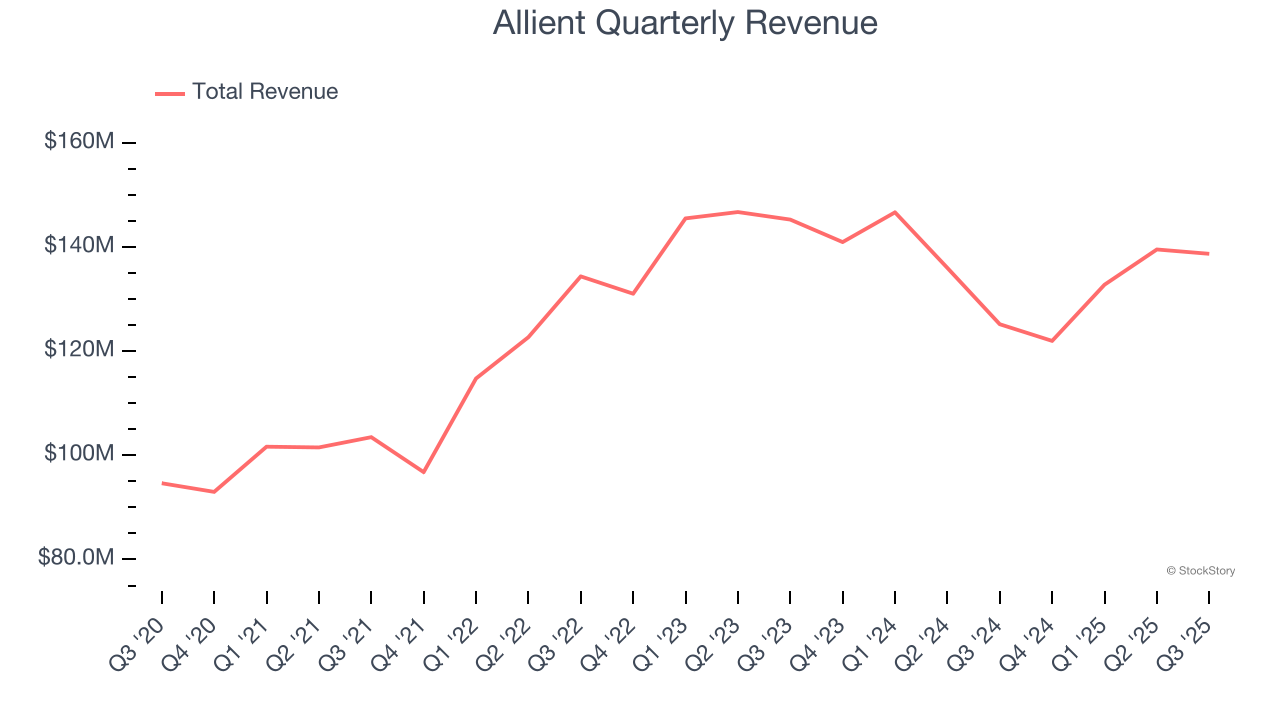
Long-term growth is the most important, but within industrials, a half-decade historical view may miss new industry trends or demand cycles. Allient’s recent performance marks a sharp pivot from its five-year trend as its revenue has shown annualized declines of 3.2% over the last two years. 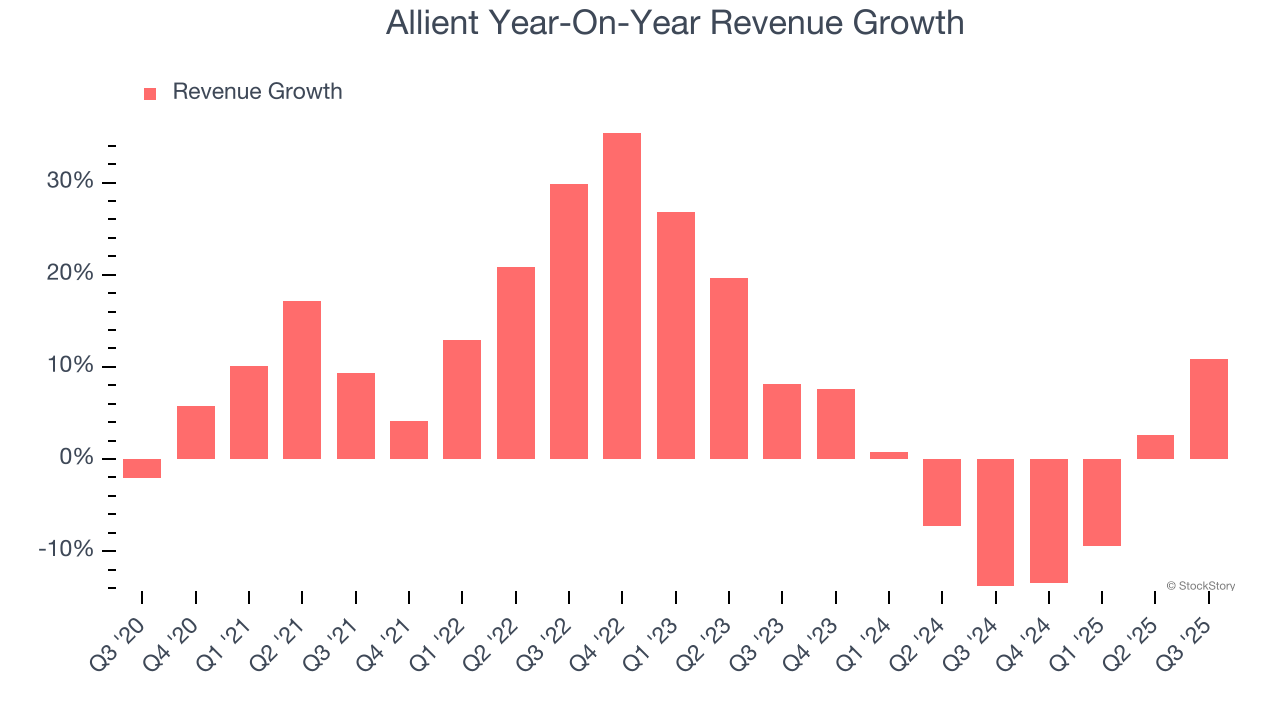
This quarter, Allient reported year-on-year revenue growth of 10.8%, and its $138.7 million of revenue exceeded Wall Street’s estimates by 3.4%.
Looking ahead, sell-side analysts expect revenue to grow 3.9% over the next 12 months. Although this projection suggests its newer products and services will fuel better top-line performance, it is still below the sector average.
Software is eating the world and there is virtually no industry left that has been untouched by it. That drives increasing demand for tools helping software developers do their jobs, whether it be monitoring critical cloud infrastructure, integrating audio and video functionality, or ensuring smooth content streaming. Click here to access a free report on our 3 favorite stocks to play this generational megatrend.
Operating Margin
Operating margin is one of the best measures of profitability because it tells us how much money a company takes home after procuring and manufacturing its products, marketing and selling those products, and most importantly, keeping them relevant through research and development.
Allient’s operating margin has risen over the last 12 months and averaged 6.9% over the last five years. The company’s higher efficiency is a breath of fresh air, but its suboptimal cost structure means it still sports mediocre profitability for an industrials business.
Analyzing the trend in its profitability, Allient’s operating margin might fluctuated slightly but has generally stayed the same over the last five years. This raises questions about the company’s expense base because its revenue growth should have given it leverage on its fixed costs, resulting in better economies of scale and profitability.
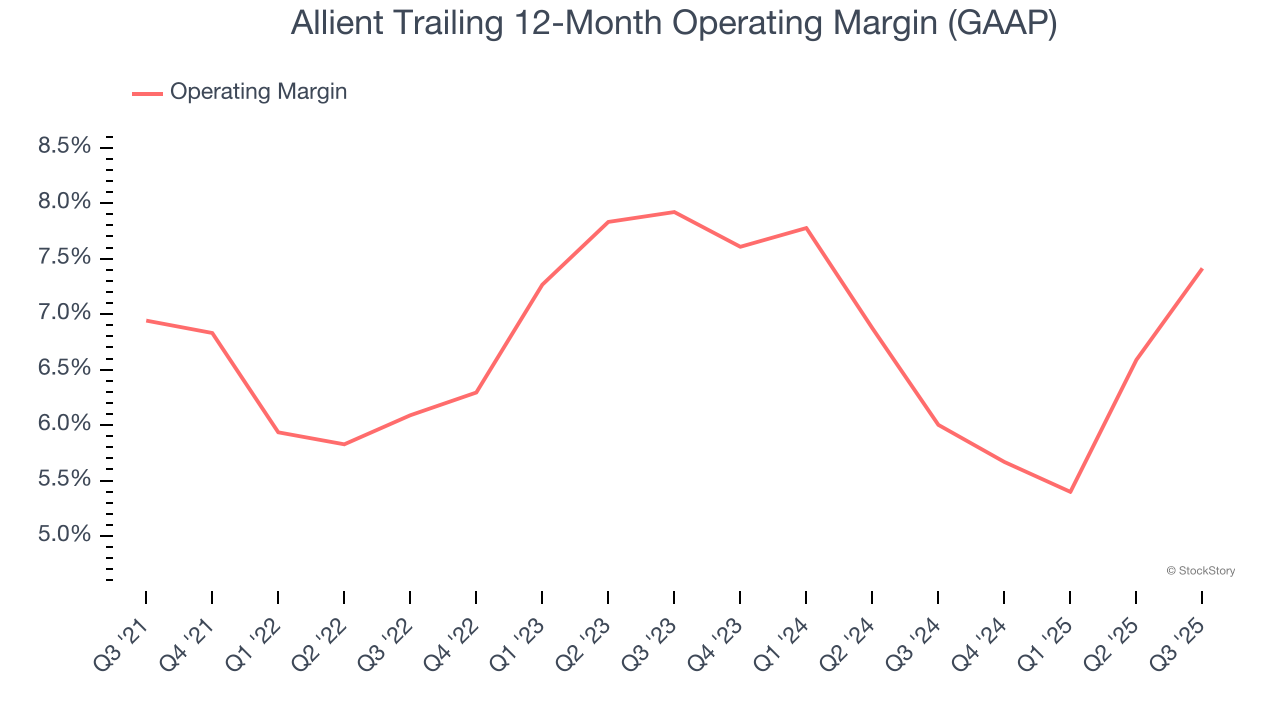
This quarter, Allient generated an operating margin profit margin of 8.8%, up 3.3 percentage points year on year. The increase was encouraging, and because its operating margin rose more than its gross margin, we can infer it was more efficient with expenses such as marketing, R&D, and administrative overhead.
Earnings Per Share
Revenue trends explain a company’s historical growth, but the long-term change in earnings per share (EPS) points to the profitability of that growth – for example, a company could inflate its sales through excessive spending on advertising and promotions.
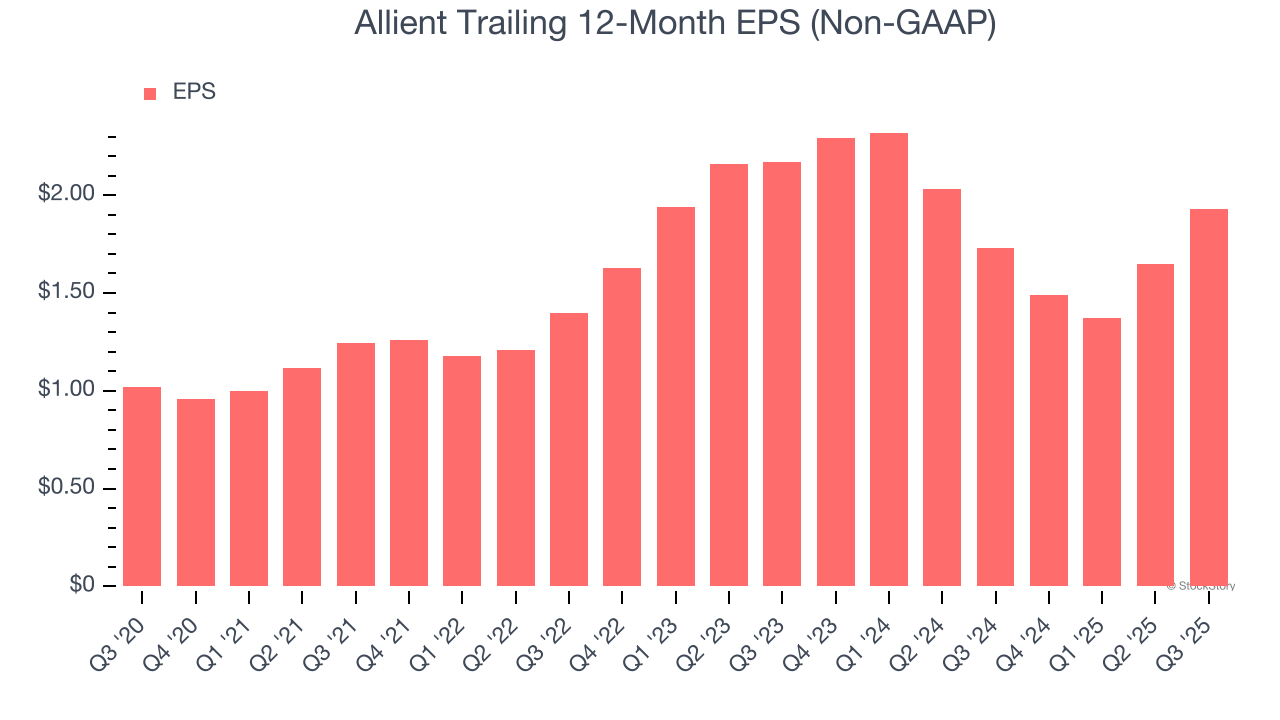
Allient’s EPS grew at a remarkable 13.6% compounded annual growth rate over the last five years, higher than its 8.1% annualized revenue growth. This tells us the company became more profitable on a per-share basis as it expanded.
Like with revenue, we analyze EPS over a more recent period because it can provide insight into an emerging theme or development for the business.
For Allient, its two-year annual EPS declines of 5.7% mark a reversal from its (seemingly) healthy five-year trend. We hope Allient can return to earnings growth in the future.
In Q3, Allient reported adjusted EPS of $0.59, up from $0.31 in the same quarter last year. This print easily cleared analysts’ estimates, and shareholders should be content with the results. Over the next 12 months, Wall Street expects Allient’s full-year EPS of $1.93 to grow 13.7%.
Key Takeaways from Allient’s Q3 Results
We were impressed by how significantly Allient blew past analysts’ EBITDA expectations this quarter. We were also glad its revenue outperformed Wall Street’s estimates. Zooming out, we think this was a solid print. The stock remained flat at $53.85 immediately following the results.
Allient may have had a good quarter, but does that mean you should invest right now? We think that the latest quarter is only one piece of the longer-term business quality puzzle. Quality, when combined with valuation, can help determine if the stock is a buy. We cover that in our actionable full research report which you can read here, it’s free for active Edge members.


