SHENZHEN, China, March 20, 2024 (GLOBE NEWSWIRE) -- LexinFintech Holdings Ltd. (“Lexin” or the “Company”) (NASDAQ: LX), a leading technology-empowered personal financial service enabler in China, today announced its unaudited financial results for the quarter and fiscal year ended December 31, 2023.
“Total loan origination for the fourth quarter reached RMB61.2 billion, with the full year figure for 2023 hitting RMB250 billion — aligning with the midpoint of the year's guidance and representing a 21.9% growth compared to the previous year. The outstanding loan balance climbed to RMB124 billion, marking a 24.5% year-over-year increase,” said Jay Wenjie Xiao, chairman and CEO of Lexin. “We experienced a fruitful 2023, showing the strong recovery and growth during a period of sluggish economic recovery and fluctuating credit markets.”
“Over the past year, Lexin has significantly enhanced its operational capabilities across various business areas, thanks to a steadfast focus on core strategies that included strengthening risk management, targeting higher-quality customer base, optimizing operations, and implementing cost-effective initiatives. Our relentless efforts yielded satisfying results in 2023, laying a strong foundation for high-quality growth and further ecosystem strengthening in 2024,” added Mr. Xiao. He also extended a warm welcome to our new Chief Risk Officer Qiao Zhanwen and his onboarding as a new director of the Company, who formerly served as a Senior Director at Ant Group and Deputy General Manager at Chongqing Ant Consumer Finance. “Mr. Qiao’s extensive experience in risk management will greatly enhance our capabilities in this area moving forward.”
“Looking into 2024, we will maintain our dual business growth engine driven by data and risk management, aiming for a healthy balance between growth and risk performance. Facing a slowly recovering macro environment, Lexin will continue to remain prudent and is committed to long-term sustainable value creation for shareholders and stakeholders. Continuing our capital return program, we have declared the dividend payout of US$0.066 per ADS for the six-month period ended December 31, 2023, roughly 20% of total net income. For the full year of 2023, we are paying out cash dividend of US$0.182 per ADS. In 2024, we expect to continue returning more value to shareholders by maintaining or increasing dividend when market conditions improve,” Mr. Xiao noted.
“Lexin delivered another set of healthy quarterly results, achieving our full-year business goals and marking a year of tangible progress,” stated James Zheng, CFO of Lexin. “The fourth quarter’s total operating revenue reached RMB3.5 billion, with the full year revenue reaching RMB13.1 billion, a 32.3% increase year-over-year. Excluding after tax impact of RMB224 million of investment related impairment losses (1), the net profit for the fourth quarter was RMB236 million, contributing to a full-year net profit of RMB1.3 billion excluding the same impact, up 56.2% from the previous year. The past quarter saw a record low funding cost, operational refinements, improved early-repayment ratios, and a slight uptick in revenue take-rate of the loan facilitation business. In summary, 2023 was a year of rebound, with strong growth in both top and bottom lines surpassing many peers, driven by our core strategies.”
_____________________________
1). The investment related impairment losses were related to the investment and related prepayment for equity interests of a domestic private bank.
Fourth Quarter and Full Year 2023 Operational Highlights:
User Base
- Total number of registered users reached 210 million as of December 31, 2023, representing an increase of 10.9% from 189 million as of December 31, 2022, and users with credit lines reached 42.3 million as of December 31, 2023, up by 5.8% from 40.0 million as of December 31, 2022.
- Number of active users1 who used our loan products in the fourth quarter of 2023 was 4.7 million, representing a decrease of 10.4% from 5.3 million in the fourth quarter of 2022. Number of active users1 who used our loan products in 2023 was 8.5 million, representing a decrease of 12.0% from 9.7 million in 2022.
- Number of cumulative borrowers with successful drawdown was 31.5 million as of December 31, 2023, an increase of 6.4% from 29.6 million as of December 31, 2022.
Loan Facilitation Business
- As of December 31, 2023, we cumulatively originated RMB1,113.1 billion in loans, an increase of 28.9% from RMB863.6 billion as of December 31, 2022.
- Total loan originations2 in the fourth quarter of 2023 was RMB61.2 billion, an increase of 9.2% from RMB56.1 billion in the fourth quarter of 2022. Total loan originations2 in 2023 was RMB250 billion, an increase of 21.9% from RMB205 billion in 2022.
- Total outstanding principal balance of loans2 reached RMB124 billion as of December 31, 2023, representing an increase of 24.5% from RMB99.6 billion as of December 31, 2022.
Credit Performance
- 90 day+ delinquency ratio was 2.90% as of December 31, 2023, as compared with 2.67% as of September 30, 2023.
- First payment default rate (30 day+) for new loan originations was below 1% as of December 31, 2023.
Tech-empowerment Service
- For the fourth quarter of 2023, we served over 80 business customers with our tech-empowerment service.
- In the fourth quarter of 2023, the business customer retention rate3 of our tech-empowerment service was over 85%.
Installment E-commerce Platform Service
- GMV4 in the fourth quarter of 2023 for our installment e-commerce platform service was RMB1,292 million, representing a decrease of 7.2% from RMB1,393 million in the fourth quarter of 2022. Total GMV4 for 2023 was RMB5,289 million, representing an increase of 20.5% from RMB4,390 million in 2022.
- In the fourth quarter of 2023, our installment e-commerce platform service served over 400,000 users and 400 merchants. In 2023, our installment e-commerce platform service served over 1,144,000 users and 1,000 merchants.
Other Operational Highlights
- The weighted average tenor of loans originated on our platform in the fourth quarter of 2023 was approximately 12.3 months, as compared with 13.9 months in the fourth quarter of 2022. The weighted average tenor of loans originated on our platform in 2023 was approximately 13.8 months, as compared with 13.1 months in 2022.
- Repeated borrowers’ contribution5 of loans across our platform for the fourth quarter of 2023 was 86.1%, for the full year of 2023 was 89.3%.
Fourth Quarter 2023 Financial Highlights:
- Total operating revenue was RMB3,509 million, representing an increase of 15.1% from the fourth quarter of 2022.
- Credit facilitation service income was RMB2,727 million, representing an increase of 38.9% from the fourth quarter of 2022. Tech-empowerment service income was RMB427 million, representing an increase of 3.4% from the fourth quarter of 2022. Installment e-commerce platform service income was RMB356 million, representing a decrease of 47.2% from the fourth quarter of 2022.
- Net income attributable to ordinary shareholders of the Company was RMB12.1 million, representing a decrease of 96.0% from the fourth quarter of 2022. Net income per ADS attributable to ordinary shareholders of the Company was RMB0.07 on a fully diluted basis.
- Adjusted net income attributable to ordinary shareholders of the Company6 was RMB284 million, representing a decrease of 27.3% from the fourth quarter of 2022. Adjusted net income per ADS attributable to ordinary shareholders of the Company6 was RMB1.64 on a fully diluted basis.
Full Year 2023 Financial Highlights:
- Total operating revenue was RMB13,057 million, representing an increase of 32.3% from 2022.
- Credit facilitation service income was RMB9,666 million, representing an increase of 62.1% from 2022. Tech-empowerment service income was RMB1,640 million, representing a decrease of 11.1% from 2022. Installment e-commerce platform service income was RMB1,751 million, representing a decrease of 14.9% from 2022.
- Net income attributable to ordinary shareholders of the Company was RMB1,066 million, representing an increase of 30.0% from 2022. Net income per ADS attributable to ordinary shareholders of the Company was RMB6.34 on a fully diluted basis.
- Adjusted net income attributable to ordinary shareholders of the Company6 was RMB1,485 million, representing an increase of 40.4% from 2022. Adjusted net income per ADS attributable to ordinary shareholders of the Company6 was RMB8.26 on a fully diluted basis.
__________________________
- Active users refer to, for a specified period, users who made at least one transaction during that period through our platform or through our third-party partners’ platforms using the credit line granted by us.
- Originations of loans and outstanding principal balance represent the origination and outstanding principal balance of both on- and off-balance sheet loans.
- Customer retention rate refers to the number of financial institution customers and partners who repurchase our service in the current quarter as a percentage of the total number of financial institution customers and partners in the preceding quarter.
- GMV refers to the total value of transactions completed for products purchased on our e-commerce and Maiya channel, net of returns.
- Repeated borrowers contribution’ for a given period refers to the principal amount of loans borrowed during that period by borrowers who had previously made at least one successful drawdown as a percentage of the total loan facilitation and origination volume through our platform during that period.
- Adjusted net income attributable to ordinary shareholders of the Company, adjusted net income per ordinary share and per ADS attributable to ordinary shareholders of the Company are non-GAAP financial measures. For more information on non-GAAP financial measures, please see the section of “Use of Non-GAAP Financial Measures Statement” and the tables captioned “Unaudited Reconciliations of GAAP and Non-GAAP Results” set forth at the end of this press release.
Fourth Quarter 2023 Financial Results:
Operating revenue increased by 15.1% from RMB3,050 million in the fourth quarter of 2022 to RMB3,509 million in the fourth quarter of 2023.
Credit facilitation service income increased by 38.9% from RMB1,964 million in the fourth quarter of 2022 to RMB2,727 million in the fourth quarter of 2023. The increase was driven by the increases in loan facilitation and servicing fees-credit oriented and guarantee income, partially offset by the decrease in financing income.
Loan facilitation and servicing fees-credit oriented increased by 83.5% from RMB849 million in the fourth quarter of 2022 to RMB1,559 million in the fourth quarter of 2023. The increase was primarily due to the increase in off-balance sheet loans originated under the credit-oriented model, as well as better control over the early repayment behaviors.
Guarantee income increased by 42.0% from RMB500 million in the fourth quarter of 2022 to RMB709 million in the fourth quarter of 2023. The increase was primarily driven by the increase in loan originations and the increase of outstanding balances in the off-balance sheet loans funded by certain institutional funding partners, which are accounted for under ASC 460, Guarantees.
Financing income decreased by 25.3% from RMB615 million in the fourth quarter of 2022 to RMB459 million in the fourth quarter of 2023. The decrease was primarily due to the decrease in the origination of on-balance sheet loans.
Tech-empowerment service income increased by 3.4% from RMB413 million in the fourth quarter of 2022 to RMB427 million in the fourth quarter of 2023. The increase was primarily driven by the growth volume of tech-empowerment SaaS, a comprehensive digitalization solution empowering the entire credit cycle that serves the transformation of retail credit business of banks.
Installment e-commerce platform service income decreased by 47.2% from RMB674 million in the fourth quarter of 2022 to RMB356 million in the fourth quarter of 2023. The decrease was primarily due to the decrease in transaction volume in the fourth quarter of 2023.
Cost of sales decreased by 47.6% from RMB657 million in the fourth quarter of 2022 to RMB344 million in the fourth quarter of 2023, which was consistent with the decrease in installment e-commerce platform service income.
Funding cost decreased by 47.9% from RMB146 million in the fourth quarter of 2022 to RMB76.2 million in the fourth quarter of 2023, which was primarily driven by the decrease in the cost of capital and funding debts to fund the on-balance sheet loans.
Processing and servicing costs increased by 10.1% from RMB467 million in the fourth quarter of 2022 to RMB514 million in the fourth quarter of 2023. This increase was primarily due to an increase in risk management and collection expenses.
Provision for financing receivables was RMB180 million for the fourth quarter of 2023, as compared to RMB147 million for the fourth quarter of 2022. The increase was primarily due to the decrease in performance of the on-balance sheet loans.
Provision for contract assets and receivables was RMB203 million in the fourth quarter of 2023, as compared to RMB131 million in the fourth quarter of 2022. The increase was primarily due to the increase in loan facilitations and servicing fees and the decrease in performance of the off-balance sheet loans.
Provision for contingent guarantee liabilities was RMB934 million in the fourth quarter of 2023, as compared to RMB459 million in the fourth quarter of 2022. The increase was primarily due to the increase in loan origination of the off-balance sheet loans funded by certain institutional funding partners, which are accounted for under ASC 460, Guarantees, as well as the decrease in performance of the off-balance sheet loans.
Gross profit increased by 20.6% from RMB1,043 million in the fourth quarter of 2022 to RMB1,258 million in the fourth quarter of 2023.
Sales and marketing expenses was RMB430 million in the fourth quarter of 2023, as compared to RMB423 million in the fourth quarter of 2022.
Research and development expenses was RMB136 million in the fourth quarter of 2023, as compared to RMB136 million in the fourth quarter of 2022.
General and administrative expenses increased by 11.6% from RMB97.1 million in the fourth quarter of 2022 to RMB108 million in the fourth quarter of 2023, primarily as a result of the increase in salaries and personnel related costs.
Change in fair value of financial guarantee derivatives and loans at fair value was a loss of RMB248 million in the fourth quarter of 2023, as compared to a gain of RMB33.2 million in the fourth quarter of 2022. The change in fair value was primarily due to the re-measurement of the expected loss rates and changes in the balances of the underlying outstanding off-balance sheet loans at the balance sheet date, partially offset by the fair value gains realized as a result of the release of guarantee obligation.
Investment loss was RMB302 million in the fourth quarter of 2023, as compared to RMB38.4 million in the fourth quarter of 2022. The increase was primarily due to investment related impairment losses recognized in the fourth quarter of 2023 for investment and related prepayment for equity interest in a domestic private bank.
Income tax benefit is RMB9.7 million in the fourth quarter of 2023 compared to income tax expense of RMB72.3 million in the fourth quarter of 2022. The change was primarily due to the decrease of income before income tax expense and the remeasurement of full year effective tax rate in the fourth quarter of 2023.
Net income decreased by 96.0% from RMB301 million in the fourth quarter of 2022 to RMB12.1 million in the fourth quarter of 2023.
Full Year 2023 Financial Results:
Operating revenue increased by 32.3% from RMB9,866 million in 2022 to RMB13,057 million in 2023.
Credit facilitation service income increased by 62.1% from RMB5,964 million in 2022 to RMB9,666 million in 2023. The increase was driven by the increases in loan facilitation and servicing fees-credit oriented, guarantee income and financing income.
Loan facilitation and servicing fees-credit oriented increased by 101% from RMB2,487 million in 2022 to RMB5,002 million in 2023. The increase was primarily due to the increase in off-balance sheet loans originated under the credit-oriented model, as well as better control over the early repayment behaviors.
Guarantee income increased by 73.4% from RMB1,453 million in 2022 to RMB2,519 million in 2023. The increase was primarily driven by the increase in loan originations and the increase of outstanding balances in the off-balance sheet loans funded by certain institutional funding partners, which are accounted for under ASC 460, Guarantees.
Financing income increased by 6.0% from RMB2,024 million in 2022 to RMB2,145 million in 2023. The increase was primarily driven by the increase in APR of loans originated of on-balance sheet loans.
Tech-empowerment service income decreased by 11.1% from RMB1,846 million in 2022 to RMB1,640 million in 2023. The decrease was primarily due to the decrease in APR of loans originated, as well as the decrease of loan facilitation volume under the profit-sharing model within tech-empowerment service as compared to 2022.
Installment e-commerce platform service income decreased by 14.9% from RMB2,056 million in 2022 to RMB1,751 million in 2023. The decrease was primarily due to the decrease in transaction volume in 2023.
Cost of sales decreased by 20.9% from RMB2,067 million in 2022 to RMB1,636 million in 2023, which was consistent with the decrease in installment e-commerce platform service income.
Funding cost was RMB514 million in 2023, as compared to RMB518 million in 2022.
Processing and servicing costs was RMB1,935 million in 2023, as compared to RMB1,875 million in 2022.
Provision for financing receivables was RMB627 million for 2023, as compared to RMB437 million for 2022. The increase was primarily due to the decrease in performance of the on-balance sheet loans.
Provision for contract assets and receivables was RMB629 million in 2023, as compared to RMB465 million in 2022. The increase was primarily due to the increase in loan facilitations and servicing fees and the decrease in performance of the off-balance sheet loans.
Provision for contingent guarantee liabilities was RMB3,203 million in 2023, as compared to RMB1,468 million in 2022. The increase was primarily due to the increase in loan origination of the off-balance sheet loans funded by certain institutional funding partners, which are accounted for under ASC 460, Guarantees, as well as the decrease in performance of the off-balance sheet loans.
Gross profit increased by 48.7% from RMB3,035 million in 2022 to RMB4,513 million in 2023.
Sales and marketing expenses was RMB1,733 million in 2023, as compared to RMB1,685 million in 2022.
Research and development expenses decreased by 12.0% from RMB583 million in 2022 to RMB513 million in 2023, primarily as a result of the Company’s improved efficiency.
General and administrative expenses decreased by 10.2% from RMB432 million in 2022 to RMB387 million in 2023, primarily as a result of the Company’s expense control measures.
Change in fair value of financial guarantee derivatives and loans at fair value was a loss of RMB206 million in 2023, as compared to a gain of RMB722 million in 2022. The change in fair value was primarily due to the re-measurement of the expected loss rates and changes in the balances of the underlying outstanding off-balance sheet loans at the balance sheet date, partially offset by the fair value gains realized as a result of the release of guarantee obligation.
Investment loss was RMB303 million in 2023, as compared to RMB33.9 million in 2022. The increase was primarily due to investment related impairment losses recognized in the fourth quarter of 2023 for investment and related prepayment for equity interest in a domestic private bank.
Income tax expense increased by 28.7% from RMB203 million in 2022 to RMB261 million in 2023. The increase in income tax expense was primarily due to the increase in the income before income tax expense in 2023.
Net income increased by 29.1% from RMB826 million in 2022 to RMB1,066 million in 2023.
Recent development
Semi-Annual Dividend
The board of directors of the Company has approved a dividend of US$0.033 per ordinary share, or US$0.066 per ADS, for the six-month period ended December 31, 2023 in accordance with the Company’s dividend policy, which is expected to be paid on May 24, 2024 to shareholders of record (including holders of ADSs) as of the close of business on April 18, 2024 New York time.
Change of Board Composition
The Company is also pleased to announce that its board of directors appointed Mr. Zhanwen Qiao, the Chief Risk Officer of the Company, as a new director of the Company, effective on March 20, 2024. Mr. Suining Xiao, as an appointee from PAG, has tendered his resignation as a director of the Company effective on April 20, 2024, since by then the Company will have fully paid off the convertible senior notes with PAG.
Outlook
Based on the Company’s preliminary assessment of the current market conditions and the prudent business approach due to the weak consumption recovery, the company expects the annual GMV amount for the full year 2024 to be no less than that of 2023 as the Company remains focused on the enhancement of risk management as the top priority.
These estimates reflect the Company's current expectation, which is subject to change.
Conference Call
The Company’s management will host an earnings conference call at 10:00 PM U.S. Eastern time on March 20, 2024 (10:00 AM Beijing/Hong Kong time on March 21, 2024).
Participants who wish to join the conference call should register online at:
https://register.vevent.com/register/BIb8c0d6de499a4b8994868f39fd1617fa
Once registration is completed, each participant will receive the dial-in number and a unique access PIN for the conference call.
Participants joining the conference call should dial in at least 10 minutes before the scheduled start time.
A live and archived webcast of the conference call will also be available at the Company's investor relations website at http://ir.lexin.com.
About LexinFintech Holdings Ltd.
We are a leading credit technology-empowered personal financial service enabler. Our mission is to use technology and risk management expertise to make financing more accessible for young generation consumers. We strive to achieve this mission by connecting consumers with financial institutions, where we facilitate through a unique model that includes online and offline channels, installment consumption platform, big data and AI driven credit risk management capabilities, as well as smart user and loan management systems. We also empower financial institutions by providing cutting-edge proprietary technology solutions to meet their needs of financial digital transformation.
For more information, please visit http://ir.lexin.com.
To follow us on Twitter, please go to: https://twitter.com/LexinFintech.
Use of Non-GAAP Financial Measures Statement
In evaluating our business, we consider and use adjusted net income attributable to ordinary shareholders of the Company, non-GAAP EBIT, adjusted net income per ordinary share and per ADS attributable to ordinary shareholders of the Company, four non-GAAP measures, as supplemental measures to review and assess our operating performance. The presentation of the non-GAAP financial measures is not intended to be considered in isolation or as a substitute for the financial information prepared and presented in accordance with U.S. GAAP. We define adjusted net income attributable to ordinary shareholders of the Company as net income attributable to ordinary shareholders of the Company excluding share-based compensation expenses, interest expense associated with convertible notes, and investment loss and we define non-GAAP EBIT as net income excluding income tax expense, share-based compensation expenses, interest expense, net, and investment loss.
We present these non-GAAP financial measures because they are used by our management to evaluate our operating performance and formulate business plans. Adjusted net income attributable to ordinary shareholders of the Company enables our management to assess our operating results without considering the impact of share-based compensation expenses, interest expense associated with convertible notes, and investment loss. Non-GAAP EBIT, on the other hand, enables our management to assess our operating results without considering the impact of income tax expense, share-based compensation expenses, interest expense, net, and investment loss. We also believe that the use of these non-GAAP financial measures facilitates investors’ assessment of our operating performance. These non-GAAP financial measures are not defined under U.S. GAAP and are not presented in accordance with U.S. GAAP.
These non-GAAP financial measures have limitations as an analytical tool. One of the key limitations of using adjusted net income attributable to ordinary shareholders of the Company and non-GAAP EBIT is that they do not reflect all items of income and expense that affect our operations. Share-based compensation expenses, interest expense associated with convertible notes, income tax expense, interest expense, net, and investment loss have been and may continue to be incurred in our business and are not reflected in the presentation of adjusted net income attributable to ordinary shareholders of the Company and non-GAAP EBIT. Further, these non-GAAP financial measures may differ from the non-GAAP financial information used by other companies, including peer companies, and therefore their comparability may be limited.
We compensate for these limitations by reconciling each of the non-GAAP financial measures to the most directly comparable U.S. GAAP financial measure, which should be considered when evaluating our performance. We encourage you to review our financial information in its entirety and not rely on a single financial measure.
Exchange Rate Information Statement
This announcement contains translations of certain RMB amounts into U.S. dollars (“US$”) at specified rates solely for the convenience of the reader. Unless otherwise stated, all translations from RMB to US$ were made at the rate of RMB7.0999 to US$1.00, the exchange rate set forth in the H.10 statistical release of the Federal Reserve Board on December 29, 2023. The Company makes no representation that the RMB or US$ amounts referred could be converted into US$ or RMB, as the case may be, at any particular rate or at all.
Safe Harbor Statement
This announcement contains forward-looking statements. These statements are made under the “safe harbor” provisions of the U.S. Private Securities Litigation Reform Act of 1995. Statements that are not historical facts, including statements about Lexin’s beliefs and expectations, are forward-looking statements. These forward-looking statements can be identified by terminology such as “will,” expects,” “anticipates,” “future,” “intends,” “plans,” “believes,” “estimates,” “confident” and similar statements. Among other things, the expectation of the collection efficiency and delinquency, business outlook and quotations from management in this announcement, contain forward-looking statements. Lexin may also make written or oral forward-looking statements in its periodic reports to the U.S. Securities and Exchange Commission (the “SEC”), in its annual report to shareholders, in press releases and other written materials and in oral statements made by its officers, directors or employees to third parties. Forward-looking statements involve inherent risks and uncertainties. A number of factors could cause actual results to differ materially from those contained in any forward-looking statement, including but not limited to the following: Lexin’s goal and strategies; Lexin’s expansion plans; Lexin’s future business development, financial condition and results of operations; Lexin’s expectation regarding demand for, and market acceptance of, its credit and investment management products; Lexin’s expectations regarding keeping and strengthening its relationship with borrowers, institutional funding partners, merchandise suppliers and other parties it collaborates with; general economic and business conditions; and assumptions underlying or related to any of the foregoing. Further information regarding these and other risks is included in Lexin’s filings with the SEC. All information provided in this press release and in the attachments is as of the date of this press release, and Lexin does not undertake any obligation to update any forward-looking statement, except as required under applicable law.
For investor and media inquiries, please contact:
LexinFintech Holdings Ltd.
IR inquiries:
Mandy Dong
Tel: +86 (755) 3637-8888 ext. 6258
E-mail: Mandydong@lexin.com
Media inquiries:
Limin Chen
Tel: +86 (755) 3637-8888 ext. 6993
E-mail: liminchen@lexin.com
SOURCE LexinFintech Holdings Ltd.
| LexinFintech Holdings Ltd. | |||||||||
| Unaudited Condensed Consolidated Balance Sheets | |||||||||
| As of | |||||||||
| (In thousands) | December 31, 2022 | December 31, 2023 | |||||||
| RMB | RMB | US$ | |||||||
| ASSETS | |||||||||
| Current Assets | |||||||||
| Cash and cash equivalents | 1,494,150 | 2,624,719 | 369,684 | ||||||
| Restricted cash | 1,267,512 | 1,433,502 | 201,905 | ||||||
| Restricted term deposit and short-term investments | 1,331,858 | 305,182 | 42,984 | ||||||
| Short-term financing receivables, net(1) | 6,397,920 | 3,944,000 | 555,501 | ||||||
| Short-term contract assets and receivables, net(1) | 3,894,175 | 6,112,981 | 860,995 | ||||||
| Deposits to insurance companies and guarantee companies | 2,249,022 | 2,613,271 | 368,072 | ||||||
| Prepayments and other current assets | 1,086,952 | 1,428,769 | 201,238 | ||||||
| Amounts due from related parties | 6,602 | 6,989 | 984 | ||||||
| Inventories, net | 53,917 | 33,605 | 4,733 | ||||||
| Total Current Assets | 17,782,108 | 18,503,018 | 2,606,096 | ||||||
| Non-current Assets | |||||||||
| Restricted cash | 168,521 | 144,948 | 20,415 | ||||||
| Long-term financing receivables, net(1) | 460,325 | 200,514 | 28,242 | ||||||
| Long-term contract assets and receivables, net(1) | 605,051 | 599,818 | 84,483 | ||||||
| Property, equipment and software, net | 284,593 | 446,640 | 62,908 | ||||||
| Land use rights, net | 931,667 | 897,267 | 126,377 | ||||||
| Long‑term investments | 348,376 | 255,003 | 35,916 | ||||||
| Deferred tax assets | 1,141,761 | 1,232,092 | 173,537 | ||||||
| Other assets | 1,048,301 | 861,491 | 121,338 | ||||||
| Total Non-current Assets | 4,988,595 | 4,637,773 | 653,216 | ||||||
| TOTAL ASSETS | 22,770,703 | 23,140,791 | 3,259,312 | ||||||
| LIABILITIES | |||||||||
| Current liabilities | |||||||||
| Accounts payable | 25,970 | 49,801 | 7,014 | ||||||
| Amounts due to related parties | 4,669 | 2,958 | 417 | ||||||
| Short‑term borrowings | 1,168,046 | 502,013 | 70,707 | ||||||
| Short‑term funding debts | 4,385,253 | 3,483,196 | 490,598 | ||||||
| Deferred guarantee income | 894,858 | 1,538,385 | 216,677 | ||||||
| Contingent guarantee liabilities | 882,107 | 1,808,540 | 254,728 | ||||||
| Accruals and other current liabilities | 3,057,469 | 4,434,254 | 624,552 | ||||||
| Convertible notes | 2,063,545 | 505,450 | 71,191 | ||||||
| Total Current Liabilities | 12,481,917 | 12,324,597 | 1,735,884 | ||||||
| Non-current Liabilities | |||||||||
| Long-term borrowings | 150,430 | 524,270 | 73,842 | ||||||
| Long‑term funding debts | 1,334,105 | 455,800 | 64,198 | ||||||
| Deferred tax liabilities | 52,559 | 75,340 | 10,611 | ||||||
| Other long-term liabilities | 102,941 | 50,702 | 7,141 | ||||||
| Total Non-current Liabilities | 1,640,035 | 1,106,112 | 155,792 | ||||||
| TOTAL LIABILITIES | 14,121,952 | 13,430,709 | 1,891,676 | ||||||
| Shareholders’ equity: | |||||||||
| Class A Ordinary Shares | 191 | 199 | 30 | ||||||
| Class B Ordinary Shares | 47 | 41 | 7 | ||||||
| Treasury stock | (328,764 | ) | (328,764 | ) | (46,305 | ) | |||
| Additional paid-in capital | 3,081,254 | 3,204,961 | 451,406 | ||||||
| Statutory reserves | 1,022,592 | 1,106,579 | 155,858 | ||||||
| Accumulated other comprehensive income | (20,842 | ) | (13,545 | ) | (1,908 | ) | |||
| Retained earnings | 4,894,273 | 5,740,611 | 808,548 | ||||||
| Total shareholders’ equity | 8,648,751 | 9,710,082 | 1,367,636 | ||||||
| TOTAL LIABILITIES AND SHAREHOLDERS’ EQUITY | 22,770,703 | 23,140,791 | 3,259,312 | ||||||
__________________________
| (1) | Short-term financing receivables, net of allowance for credit losses of RMB184,187 and RMB58,594 as of December 31, 2022 and December 31, 2023, respectively. |
| Short-term contract assets and receivables, net of allowance for credit losses of RMB216,850 and RMB436,136 as of December 31, 2022 and December 31, 2023, respectively. | |
| Long-term financing receivables, net of allowance for credit losses of RMB13,220 and RMB3,087 as of December 31, 2022 and December 31, 2023, respectively. | |
| Long-term contract assets and receivables, net of allowance for credit losses of RMB52,742 and RMB61,838 as of December 31, 2022 and December 31, 2023, respectively. |
| LexinFintech Holdings Ltd. | |||||||||||||||||||
| Unaudited Condensed Consolidated Statements of Operations | |||||||||||||||||||
| For the Three Months Ended December 31, | For the Year Ended December 31, | ||||||||||||||||||
| (In thousands, except for share and per share data) | 2022 | 2023 | 2022 | 2023 | |||||||||||||||
| RMB | RMB | US$ | RMB | RMB | US$ | ||||||||||||||
| Operating revenue: | |||||||||||||||||||
| Credit facilitation service income | 1,963,503 | 2,727,020 | 384,093 | 5,963,803 | 9,666,120 | 1,361,445 | |||||||||||||
| Loan facilitation and servicing fees-credit oriented | 849,240 | 1,558,588 | 219,523 | 2,486,527 | 5,001,881 | 704,500 | |||||||||||||
| Guarantee income | 499,662 | 709,422 | 99,920 | 1,453,180 | 2,519,284 | 354,834 | |||||||||||||
| Financing income | 614,601 | 459,010 | 64,650 | 2,024,096 | 2,144,955 | 302,111 | |||||||||||||
| Tech-empowerment service income | 412,769 | 426,882 | 60,125 | 1,845,943 | 1,640,453 | 231,053 | |||||||||||||
| Installment e-commerce platform service income | 673,994 | 355,534 | 50,076 | 2,056,065 | 1,750,509 | 246,554 | |||||||||||||
| Total operating revenue | 3,050,266 | 3,509,436 | 494,294 | 9,865,811 | 13,057,082 | 1,839,052 | |||||||||||||
| Operating cost | |||||||||||||||||||
| Cost of sales | (656,539 | ) | (344,088 | ) | (48,464 | ) | (2,066,804 | ) | (1,635,635 | ) | (230,374 | ) | |||||||
| Funding cost | (146,375 | ) | (76,195 | ) | (10,732 | ) | (518,069 | ) | (513,869 | ) | (72,377 | ) | |||||||
| Processing and servicing cost | (466,935 | ) | (514,070 | ) | (72,405 | ) | (1,875,292 | ) | (1,935,016 | ) | (272,541 | ) | |||||||
| Provision for financing receivables | (146,515 | ) | (180,475 | ) | (25,419 | ) | (437,477 | ) | (627,061 | ) | (88,320 | ) | |||||||
| Provision for contract assets and receivables | (131,292 | ) | (202,677 | ) | (28,546 | ) | (465,188 | ) | (629,308 | ) | (88,636 | ) | |||||||
| Provision for contingent guarantee liabilities | (459,252 | ) | (933,854 | ) | (131,531 | ) | (1,468,265 | ) | (3,203,123 | ) | (451,150 | ) | |||||||
| Total operating cost | (2,006,908 | ) | (2,251,359 | ) | (317,097 | ) | (6,831,095 | ) | (8,544,012 | ) | (1,203,398 | ) | |||||||
| Gross profit | 1,043,358 | 1,258,077 | 177,197 | 3,034,716 | 4,513,070 | 635,654 | |||||||||||||
| Operating expenses: | |||||||||||||||||||
| Sales and marketing expenses | (422,997 | ) | (429,573 | ) | (60,504 | ) | (1,685,438 | ) | (1,733,301 | ) | (244,130 | ) | |||||||
| Research and development expenses | (135,665 | ) | (135,837 | ) | (19,132 | ) | (583,260 | ) | (513,284 | ) | (72,295 | ) | |||||||
| General and administrative expenses | (97,058 | ) | (108,305 | ) | (15,254 | ) | (431,571 | ) | (387,387 | ) | (54,562 | ) | |||||||
| Total operating expenses | (655,720 | ) | (673,715 | ) | (94,890 | ) | (2,700,269 | ) | (2,633,972 | ) | (370,987 | ) | |||||||
| Change in fair value of financial guarantee derivatives and loans at fair value | 33,185 | (247,526 | ) | (34,863 | ) | 722,381 | (206,368 | ) | (29,066 | ) | |||||||||
| Interest expense, net | (8,187 | ) | (10,245 | ) | (1,443 | ) | (55,636 | ) | (50,483 | ) | (7,110 | ) | |||||||
| Investment loss | (38,423 | ) | (302,128 | ) | (42,554 | ) | (33,944 | ) | (303,235 | ) | (42,710 | ) | |||||||
| Others, net | (608 | ) | (22,092 | ) | (3,112 | ) | 61,321 | 7,774 | 1,095 | ||||||||||
| Income before income tax expense | 373,605 | 2,371 | 335 | 1,028,569 | 1,326,786 | 186,876 | |||||||||||||
| Income tax (expense)/benefit | (72,302 | ) | 9,726 | 1,370 | (202,640 | ) | (260,841 | ) | (36,739 | ) | |||||||||
| Net income | 301,303 | 12,097 | 1,705 | 825,929 | 1,065,945 | 150,137 | |||||||||||||
| Less: net (loss)/ income attributable to non-controlling interests | (113 | ) | - | - | 6,177 | - | - | ||||||||||||
| Net income attributable to ordinary shareholders of the Company | 301,416 | 12,097 | 1,705 | 819,752 | 1,065,945 | 150,137 | |||||||||||||
| Net income per ordinary share attributable to ordinary shareholders of the Company | |||||||||||||||||||
| Basic | 0.92 | 0.04 | 0.01 | 2.36 | 3.24 | 0.46 | |||||||||||||
| Diluted | 0.84 | 0.04 | 0.01 | 2.21 | 3.17 | 0.45 | |||||||||||||
| Net income per ADS attributable to ordinary shareholders of the Company | |||||||||||||||||||
| Basic | 1.84 | 0.07 | 0.01 | 4.71 | 6.49 | 0.91 | |||||||||||||
| Diluted | 1.68 | 0.07 | 0.01 | 4.41 | 6.34 | 0.89 | |||||||||||||
| Weighted average ordinary shares outstanding | |||||||||||||||||||
| Basic | 328,034,709 | 329,297,640 | 329,297,640 | 348,048,245 | 328,523,952 | 328,523,952 | |||||||||||||
| Diluted | 372,659,684 | 331,941,385 | 331,941,385 | 392,756,821 | 359,820,982 | 359,820,982 | |||||||||||||
| LexinFintech Holdings Ltd. | |||||||||||||||||||
| Unaudited Condensed Consolidated Statements of Comprehensive Income | |||||||||||||||||||
| For the Three Months Ended December 31, | For the Year Ended December 31, | ||||||||||||||||||
| (In thousands) | 2022 | 2023 | 2022 | 2023 | |||||||||||||||
| RMB | RMB | US$ | RMB | RMB | US$ | ||||||||||||||
| Net income | 301,303 | 12,097 | 1,705 | 825,929 | 1,065,945 | 150,137 | |||||||||||||
| Other comprehensive income | |||||||||||||||||||
| Foreign currency translation adjustment, net of nil tax | 12,662 | 27,841 | 3,921 | (32,115 | ) | 7,297 | 1,028 | ||||||||||||
| Total comprehensive income | 313,965 | 39,938 | 5,626 | 793,814 | 1,073,242 | 151,165 | |||||||||||||
| Less: net (loss)/ income attributable to non-controlling interests | (113 | ) | - | - | 6,177 | - | - | ||||||||||||
| Total comprehensive income attributable to ordinary shareholders of the Company | 314,078 | 39,938 | 5,626 | 787,637 | 1,073,242 | 151,165 | |||||||||||||
| LexinFintech Holdings Ltd. | |||||||||||||||||||
| Unaudited Reconciliations of GAAP and Non-GAAP Results | |||||||||||||||||||
| For the Three Months Ended December 31, | For the Year Ended December 31, | ||||||||||||||||||
| (In thousands, except for share and per share data) | 2022 | 2023 | 2022 | 2023 | |||||||||||||||
| RMB | RMB | US$ | RMB | RMB | US$ | ||||||||||||||
| Reconciliation of Adjusted net income attributable to ordinary shareholders of the Company to Net income attributable to ordinary shareholders of the Company | |||||||||||||||||||
| Net income attributable to ordinary shareholders of the Company | 301,416 | 12,097 | 1,705 | 819,752 | 1,065,945 | 150,137 | |||||||||||||
| Add: Share-based compensation expenses | 36,539 | 32,959 | 4,642 | 156,320 | 117,852 | 16,599 | |||||||||||||
| Interest expense associated with convertible notes | 12,449 | 11,943 | 1,682 | 46,903 | 73,807 | 10,395 | |||||||||||||
| Investment loss | 38,423 | 302,128 | 42,554 | 33,944 | 303,235 | 42,710 | |||||||||||||
| Tax effects on Non-GAAP adjustments(2) | 1,231 | (75,440 | ) | (10,625 | ) | 1,231 | (75,440 | ) | (10,625 | ) | |||||||||
| Adjusted net income attributable to ordinary shareholders of the Company | 390,058 | 283,687 | 39,958 | 1,058,150 | 1,485,399 | 209,216 | |||||||||||||
| Adjusted net income per ordinary share attributable to ordinary shareholders of the Company | |||||||||||||||||||
| Basic | 1.19 | 0.86 | 0.12 | 3.04 | 4.52 | 0.64 | |||||||||||||
| Diluted | 1.05 | 0.82 | 0.12 | 2.69 | 4.13 | 0.58 | |||||||||||||
| Adjusted net income per ADS attributable to ordinary shareholders of the Company | |||||||||||||||||||
| Basic | 2.38 | 1.72 | 0.24 | 6.08 | 9.04 | 1.27 | |||||||||||||
| Diluted | 2.09 | 1.64 | 0.23 | 5.39 | 8.26 | 1.16 | |||||||||||||
| weighted average shares used in calculating net income per ordinary share for non-GAAP EPS | |||||||||||||||||||
| Basic | 328,034,709 | 329,297,640 | 329,297,640 | 348,048,245 | 328,523,952 | 328,523,952 | |||||||||||||
| Diluted | 372,659,684 | 345,913,435 | 345,913,435 | 392,756,821 | 359,820,982 | 359,820,982 | |||||||||||||
| Reconciliations of Non-GAAP EBIT to Net income | |||||||||||||||||||
| Net income | 301,303 | 12,097 | 1,705 | 825,929 | 1,065,945 | 150,137 | |||||||||||||
| Add: Income tax expense | 72,302 | (9,726 | ) | (1,370 | ) | 202,640 | 260,841 | 36,739 | |||||||||||
| Share-based compensation expenses | 36,539 | 32,959 | 4,642 | 156,320 | 117,852 | 16,599 | |||||||||||||
| Interest expense, net | 8,187 | 10,245 | 1,443 | 55,636 | 50,483 | 7,110 | |||||||||||||
| Investment loss | 38,423 | 302,128 | 42,554 | 33,944 | 303,235 | 42,710 | |||||||||||||
| Non-GAAP EBIT | 456,754 | 347,703 | 48,974 | 1,274,469 | 1,798,356 | 253,295 | |||||||||||||
__________________________
(2) To exclude the tax effects related to the investment loss
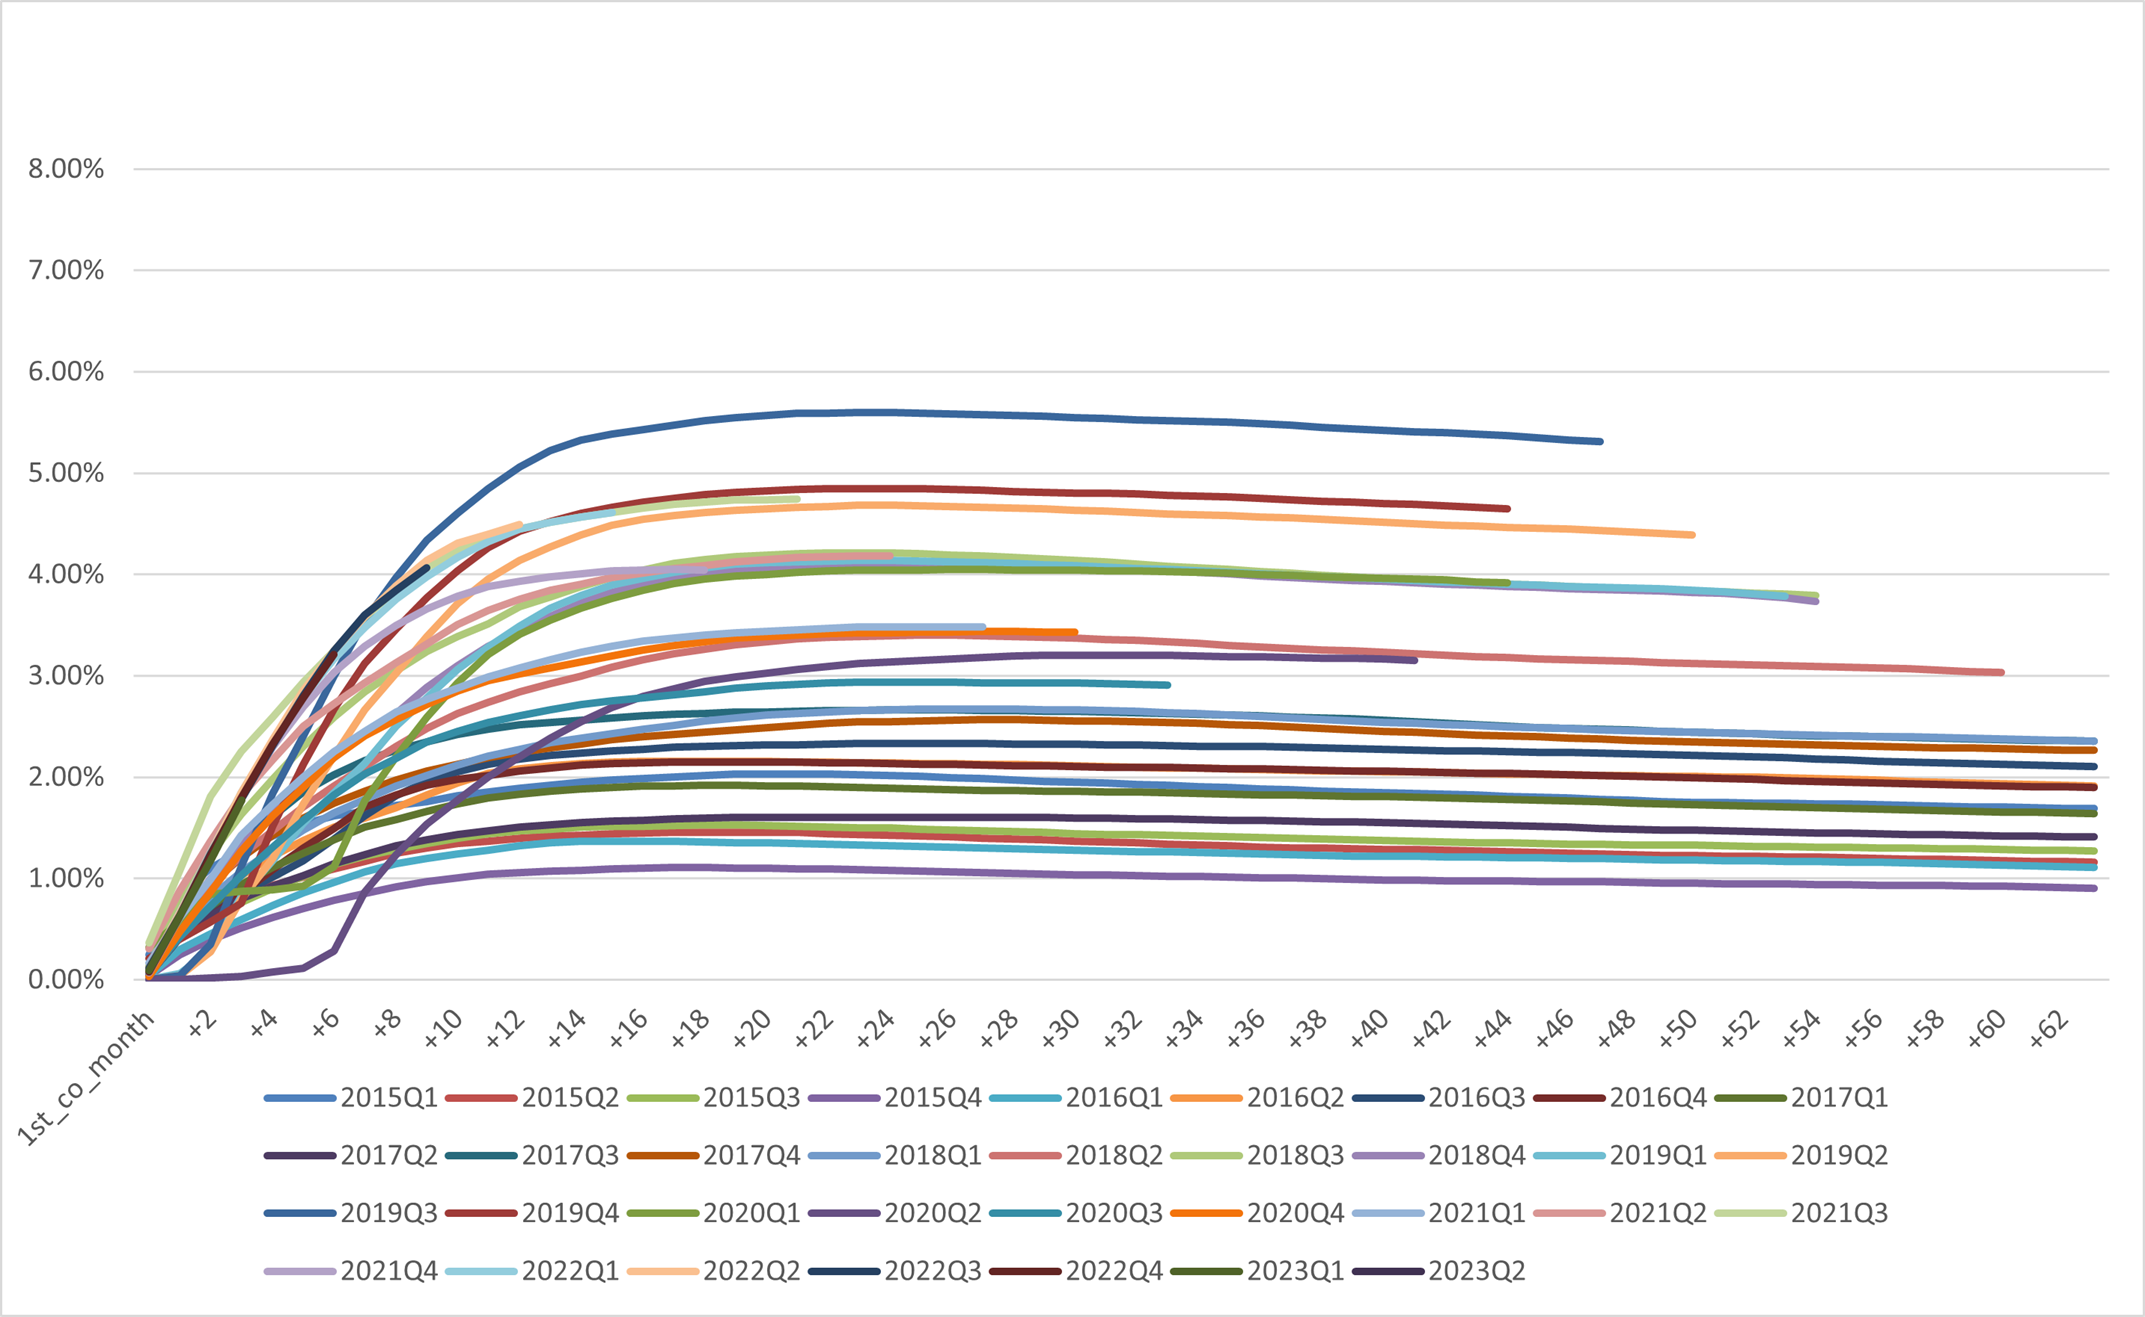
Additional Credit Information
Vintage Charge Off Curve
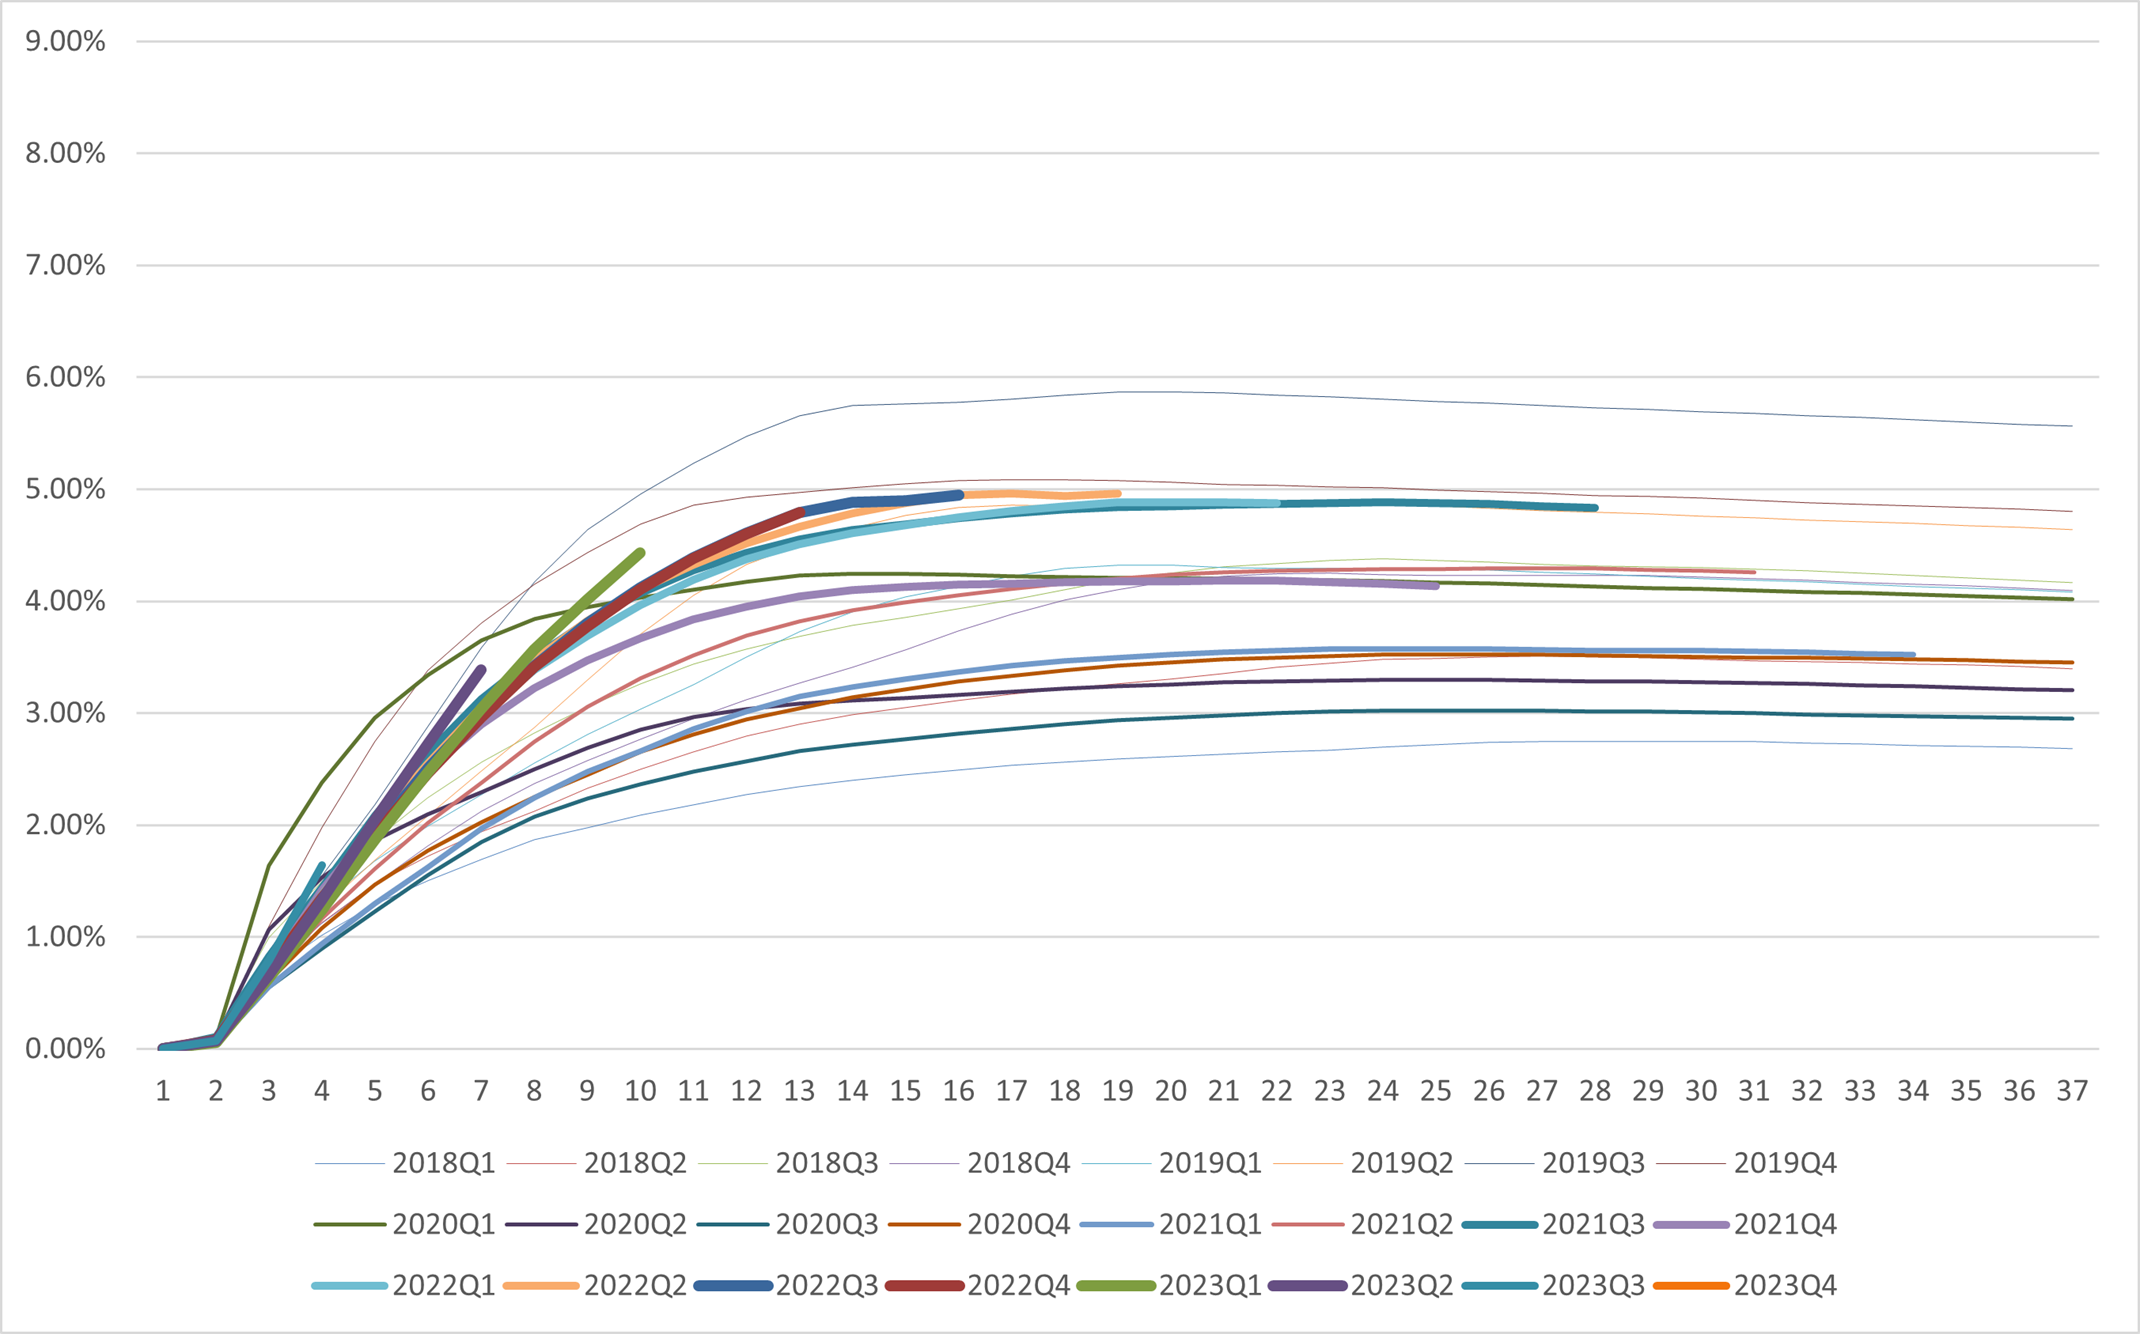
Dpd30+/GMV by Performance Windows
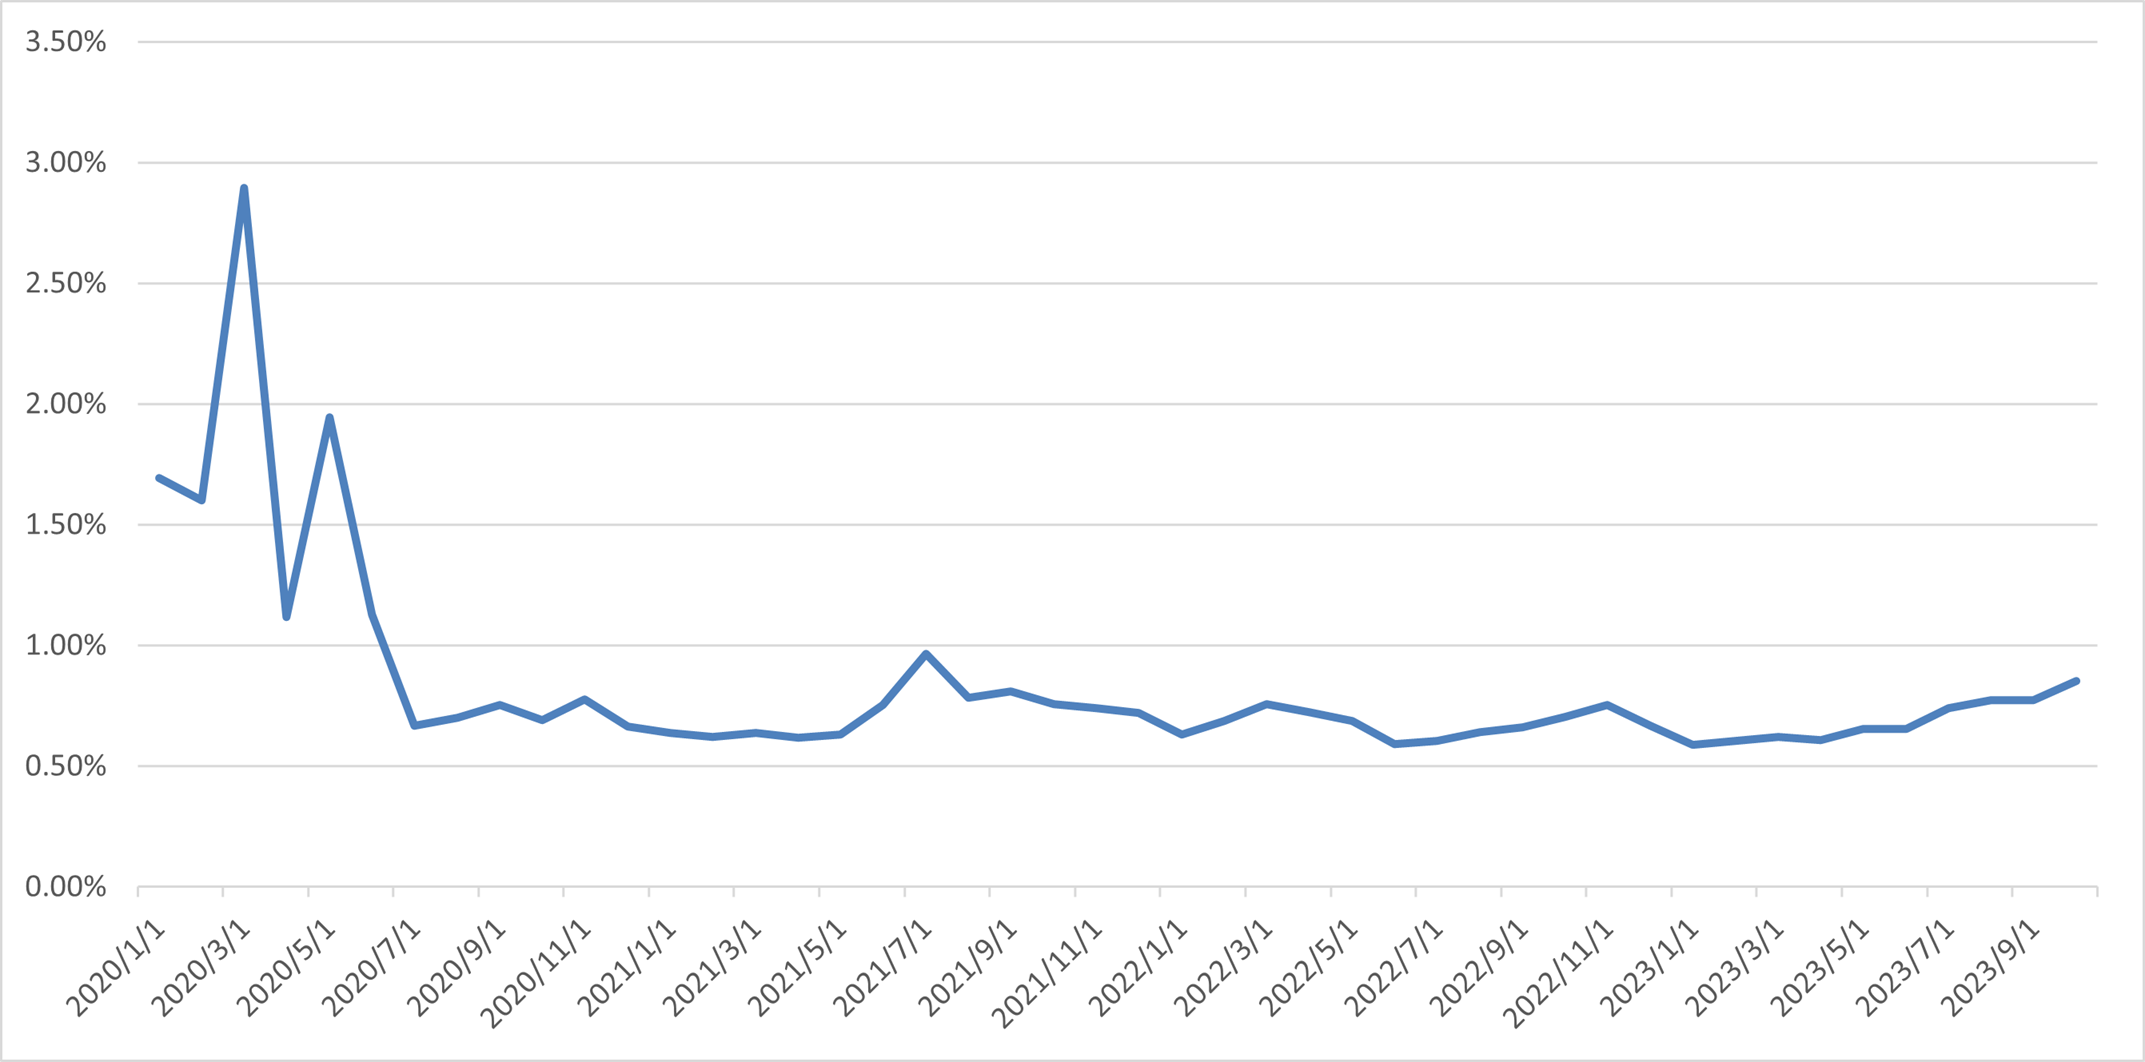
First Payment Default 30+

![]()