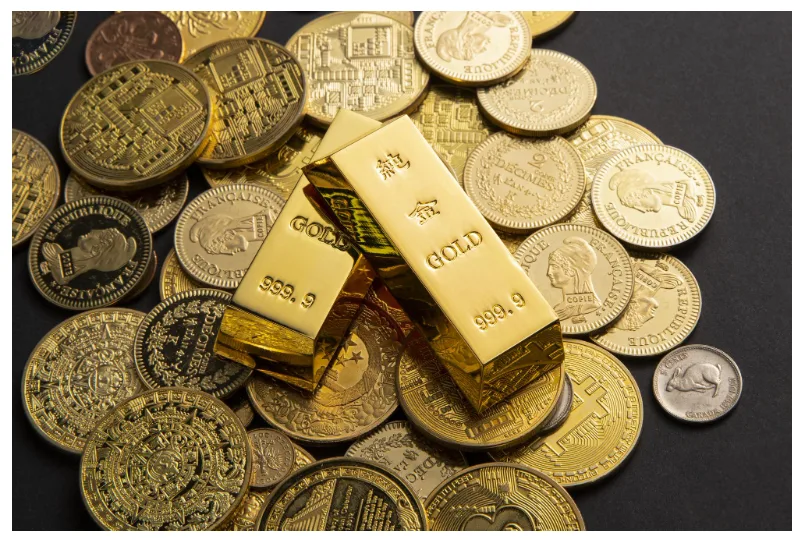
Gold changed hands near $4,078 an ounce on July 22, roughly 27 percent below the record of about $5,595 it set on January 29. Silver sits near $58.80, which is less than half its January peak of around $121.
Both metals spent the first half of 2026 giving back a spectacular run. Neither has come close to the targets the major banks are still publishing.
That gap is the story going into the back half of the year. Every mainstream year-end forecast for gold currently sits above the spot price, in some cases by a wide margin. The same holds for silver. Either the desks are going to be wrong in unison, or the second half looks very different from the first.
The gold consensus has not followed the price down
Year-end 2026 targets for gold cluster between roughly $4,900 and $6,300. Goldman Sachs marks the low end after cutting its number to about $4,900 in June, a revision it tied to a Federal Reserve that now looks unlikely to ease this year and to fading inflows into gold ETFs. JP Morgan and Wells Fargo anchor the top of the range near $6,000 to $6,300. A Reuters poll of analysts produced a median close to $4,900.
Even the most cautious of those figures implies a substantial move from where gold trades today.
The disagreement between the camps comes down to a single variable: whether the Fed cuts. Lower rates reduce the opportunity cost of holding an asset that pays no yield and tend to reopen the ETF buying channel that powered the 2025 rally. Rates staying high do the opposite. Everything else in the bull case, including central-bank reserve diversification, rising government debt and slow growth in mine supply, moves on a timescale measured in years rather than quarters. A fuller breakdown of the individual bank targets and the assumptions behind them is set out in MyInvestAcademy’s gold price forecast.
Silver fell harder, and the reason it might recover is different
Silver’s correction was far steeper. Down more than 50 percent from the January high, it has been the more punishing position to hold this year.
The forecasts for it are also further from the market. J.P. Morgan projects an average near $81 an ounce across 2026. Commerzbank has pointed to $90 by year-end and $95 by the end of 2027. A Reuters analyst poll in February landed at $79.50. Against a spot price under $59, those are not small gaps.
What separates silver from gold is that its case does not rest primarily on monetary policy. The Silver Institute has now tracked five consecutive years of global supply deficits, with a sixth widely expected in 2026 at roughly 46 million ounces. Deficits of that kind do not resolve quickly, because a large share of industrial silver is consumed rather than recovered.
The demand side keeps growing regardless of what the Fed does. Solar manufacturing alone accounts for somewhere near 16 percent of annual global silver demand, and semiconductors, electric vehicles, 5G equipment and medical devices all depend on the metal’s conductivity. The build-out of AI infrastructure sits on top of that, since data centres require both electronics and generating capacity.
That combination, a market short on supply meeting demand that is structural rather than speculative, is the argument laid out in the silver price forecast. It is a slower argument than the gold one, and it is less dependent on any single policy decision.
The ratio has quietly normalised
One number worth watching sits between the two metals. At current prices the gold-to-silver ratio is just under 70, back in line with its modern long-term average after compressing sharply during the January run and then reversing through the spring.
Historically the ratio widens when investors want safety and narrows when industrial demand leads. It is currently doing neither. For anyone weighing an allocation between the two, the ratio is not signalling that either metal is obviously mispriced against the other right now.
What would break each case
Taking the downside seriously matters more than usual after a correction of this size.
For gold: a Fed that stays hawkish or turns more so, a durable dollar rally, a meaningful de-escalation in geopolitical risk that strips out the safe-haven premium, or continued profit-taking after the 2025 gains.
For silver: an industrial slowdown that softens demand from solar and electronics, faster growth in mine supply or recycling, or the plain fact that silver is more volatile than gold in both directions and has already demonstrated it this year.
Price targets are opinions with assumptions attached, and they get revised the moment those assumptions change. That is precisely what happened across several desks in June. The useful signal is not the exact figure but the direction the analysts lean and the reasoning they give for it.